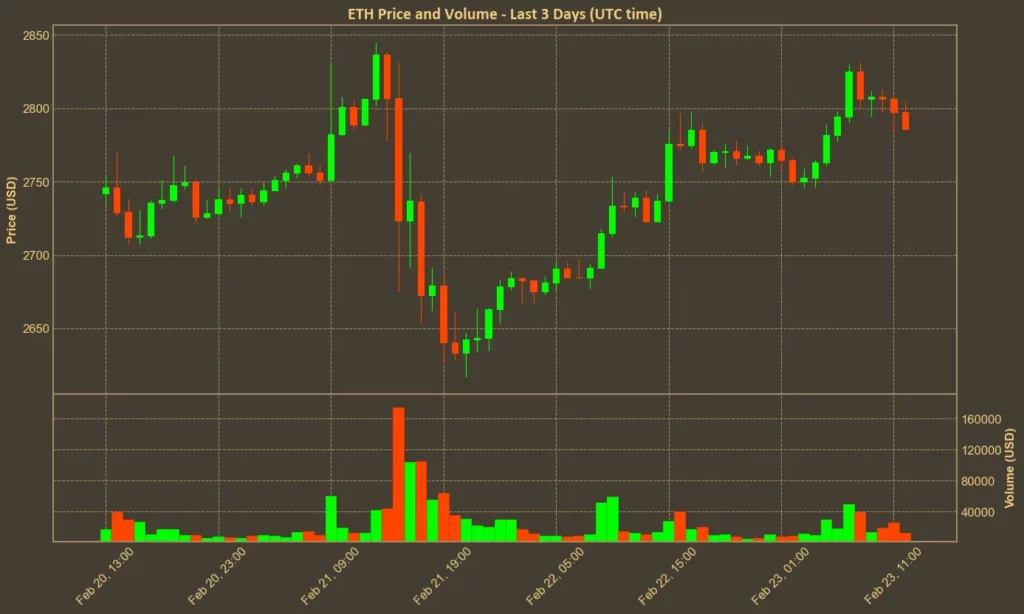
The recent hack of the crypto exchange Bybit, resulting in the loss worth over 400,000 ETH, has significantly affected Ethereum’s price. Just before the breach, Ethereum was trading near $2,840, but it swiftly dropped below $2,650 in the following hours.
Two days later, when the first panic has faded and Bybit remained solvent and managed to handle all the withdrawal requests, the confidence comes back into crypto markets, and Ethereum recovers, trying to break $2800 once again.
Can Ethereum fully rebound from this recent setback and break through the $3,000 barrier after weeks of underperformance? Will the upcoming Pectra upgrade boost investor confidence, or does uncertainty linger due to the Bybit hack? We examined technical indicators to explore these questions.
Table of Contents
Momentum Indicators
RSI: Neutral
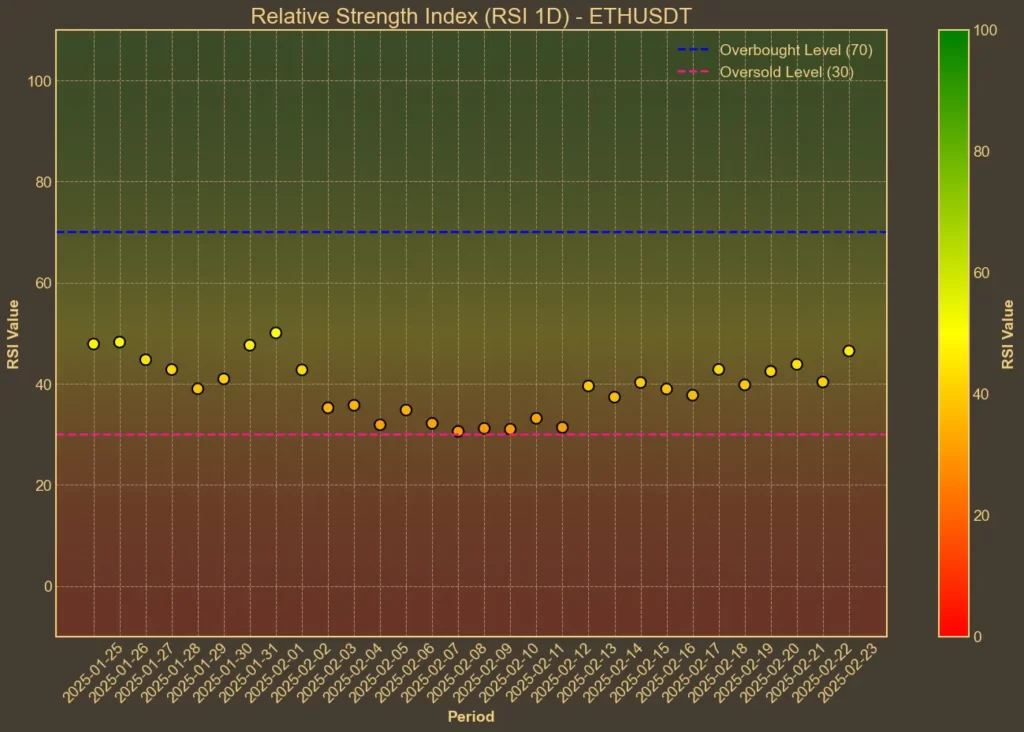
The Relative Strength Index (RSI) is hovering around 48, indicating a balanced market sentiment. We can see a slight uptick over the last two weeks, but overall readings suggesting that Ethereum is neither overbought nor oversold at the moment. This stable RSI can be a sign that the market is waiting for the next significant move.
MFI: Neutral
The Money Flow Index (MFI) stands at 56, up from 50 yesterday and significantly higher than 36 a week ago. This increase shows that there is moderate buying pressure, but it’s not strong enough to signal a clear trend. Investors might see this as a sign that ETH is maintaining steady interest without extreme reactions.
Fear & Greed Index: Neutral
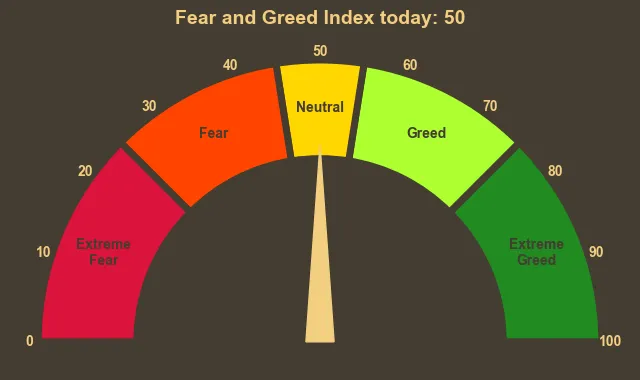
With the Fear & Greed Index hovering around 50 last week, the overall market sentiment remains balanced. This neutral stance suggests that traders are neither overly fearful nor excessively greedy, which can lead to more predictable price movements in the short term. Notably, the hack hasn’t significantly shifted market sentiment toward fear.
Moving Averages
SMA & EMA: Slightly Bullish
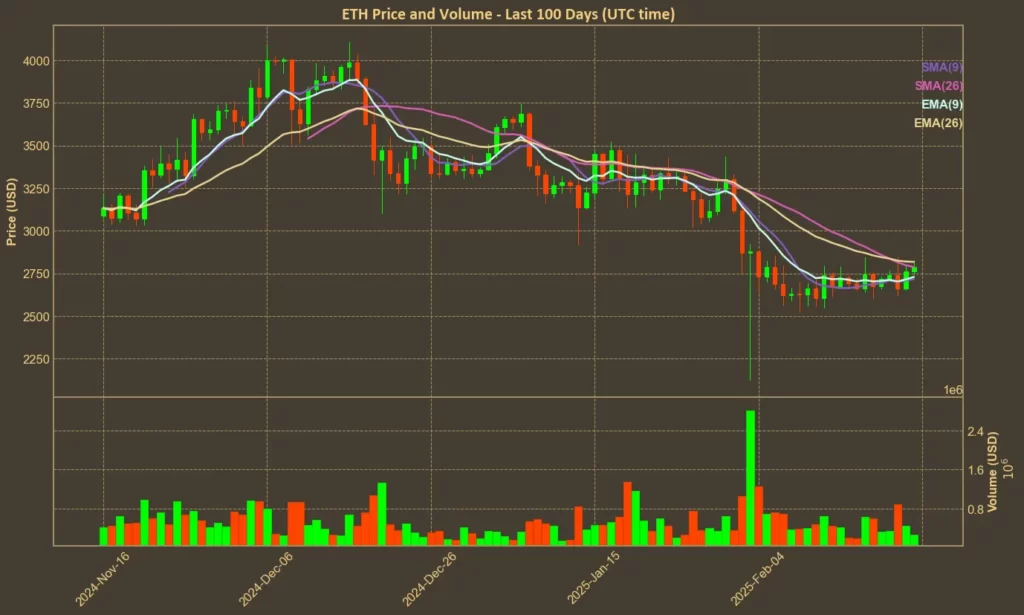
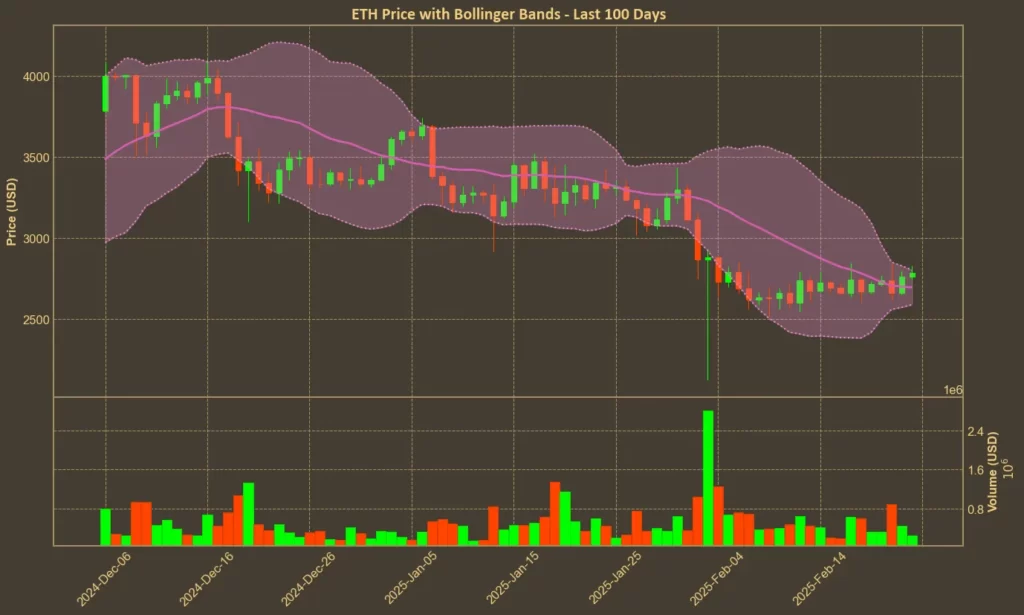
Ethereum’s 9-day Simple Moving Average (SMA) is at $2,716, while the 9-day Exponential Moving Average (EMA) is slightly higher at $2,730. The 26-day SMA and EMA are at $2,787 and $2,818, respectively. These moving averages indicate a gently upward trend, suggesting that recent price actions are slightly bullish.
Bollinger Bands: Overbought
Currently, Ethereum is trading near the upper Bollinger Band at $2,805. Being close to the upper band may indicate that the asset is overbought in the short term. Traders might anticipate a price correction or consolidation as the market digests recent gains.
Trend & Volatility Indicators
ATR: Lower Volatility
The Average True Range (ATR) has decreased to 166, down from 172 the previous day and 187 a week ago. This decline points to reduced volatility, suggesting that price swings may be calmer in the near future. Lower volatility can provide a more stable environment for investors to make decisions.
AO: Bearish, But Improving
The Awesome Oscillator (AO) is at -159, showing improvement from -196 yesterday and -323 a week ago. While the positive movement is a good sign, the negative value still indicates bearish momentum. This mixed signal requires careful consideration by traders.
VWAP: Below Average
Ethereum is trading below the Volume Weighted Average Price (VWAP) of $3,276. Being below VWAP can signal that the current price is weaker compared to the average trading price, potentially suggesting further downward pressure.
Relative Performance
Comparison Against BTC: Rising
The ETH/BTC ratio has increased by approximately 5.1% over the past week, although it has fallen by over 8% in the last month. This rising trend over the short term indicates that Ethereum is performing better against Bitcoin recently, which might attract investors looking for relative strength.
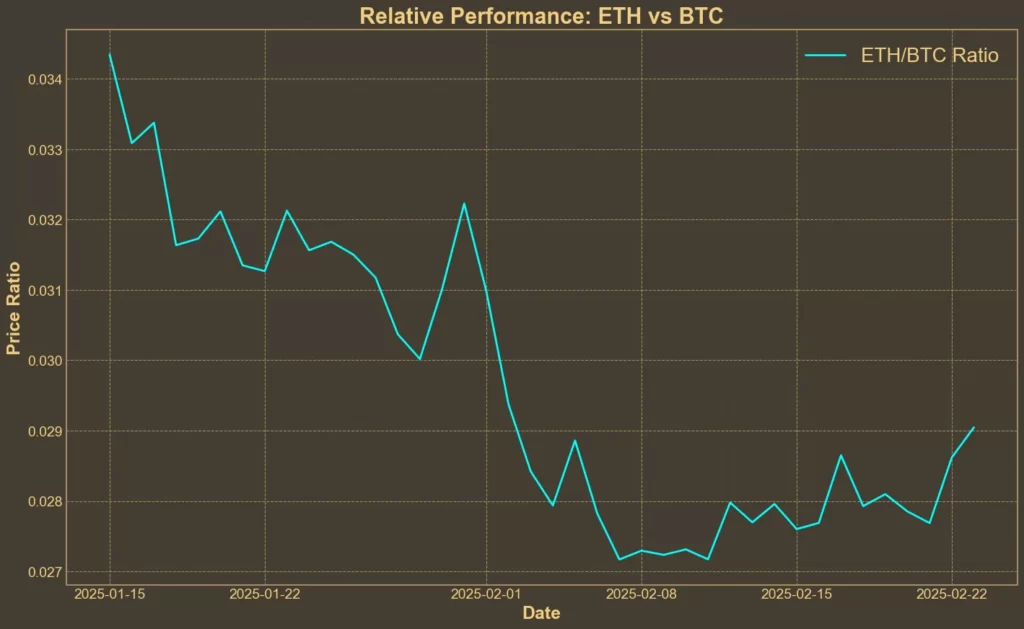
However, it continues to underperform against Bitcoin and major altcoins like XRP, Solana, and BNB in the long term.
Is Rolling Back Ethereum a Possibility?
Following the Bybit hack, some proposed rolling back Ethereum to reverse the theft. However, this idea faced strong opposition from core developers, making a rollback highly unlikely. Although it could undo the hack, it would also reverse all transactions since then, including legitimate trades, leading to financial chaos and undermining decentralization principles.
Developers argue that the fallout from a rollback would be worse than the hack itself. While it might benefit Bybit, it would create significant losses for others, making it an impractical solution.
Final Thoughts
Technical indicators present a mixed outlook, but sentiment metrics like RSI, MFI, and the Fear & Greed Index suggest that the Bybit hack did not heavily dent investor confidence about Ethereum. The market remains neutral overall.
However, external factors such as security breaches or regulatory changes could impact prices. Additionally, the outcome of the Pectra upgrade on testnets is likely to influence Ethereum’s near-term trajectory.
Need a quick and easy way to see what’s happening in crypto over the next few days? Check out our Crypto Events Calendar!


