Ethereum has been trying to hold above the $2,000 mark after suffering a steep decline over the last quarter. Trading above $3,500 at the beginning of the year, it’s now priced near $2,050 – down over 40% in the past three months and nearly the same year-over-year.

This decline places Ethereum at its lowest Q1 performance in history. Despite that, the coin still holds its position as the second-largest cryptocurrency by market capitalization, and recent buying pressure suggests that some investors may see this level as an opportunity.
Short-term price action remains volatile, but the recent weekly increase of 8% shows that ETH has been trying to build a base around $2,000. The volume has surged over the past seven days, up by 92%, which often indicates renewed market interest. Still, price and market cap are struggling to regain upward momentum after February’s drop.
Table of Contents
Momentum Indicators
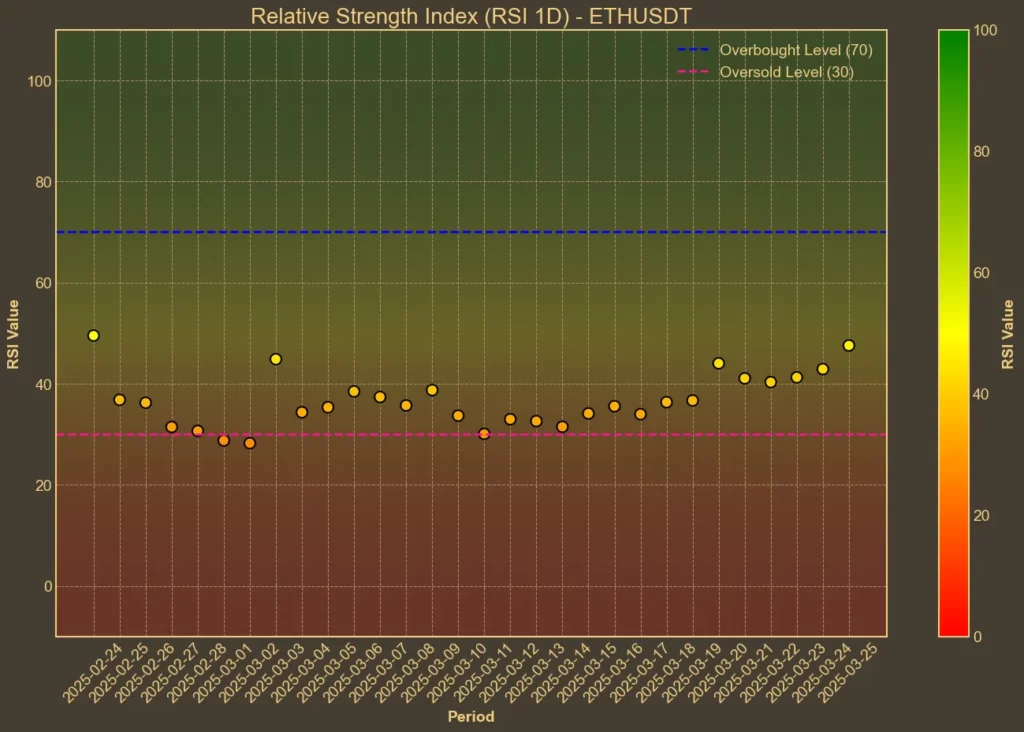
RSI: Neutral
The Relative Strength Index (RSI) gauges whether a coin is overbought or oversold. A 14-day RSI of 46 suggests the market is balanced, but not yet in bullish territory. The shorter RSI(7) is at 58 – noticeably higher – hinting at rising bullish momentum in the short term.
MFI: Bullish
The Money Flow Index combines price with trading volume to assess capital inflows. With the MFI(14) rising from 41 to 65 in just one week, there’s a clear uptick in buying activity. This indicator reflects stronger interest compared to the beginning of the month, when Ethereum faced sharp selloffs.
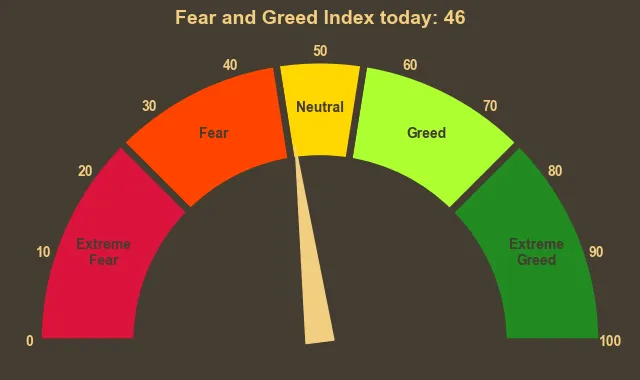
Fear & Greed Index: Neutral
This sentiment indicator for the entire crypto market moved from a low of 30 to 46 in recent days. Such a sharp swing reflects growing optimism, but the value remains below 50, indicating caution. Sentiment is improving but not yet strong enough to confirm a shift in trend.
Read more: How To Use Crypto Fear and Greed Index To Your Advantage?
Moving Averages
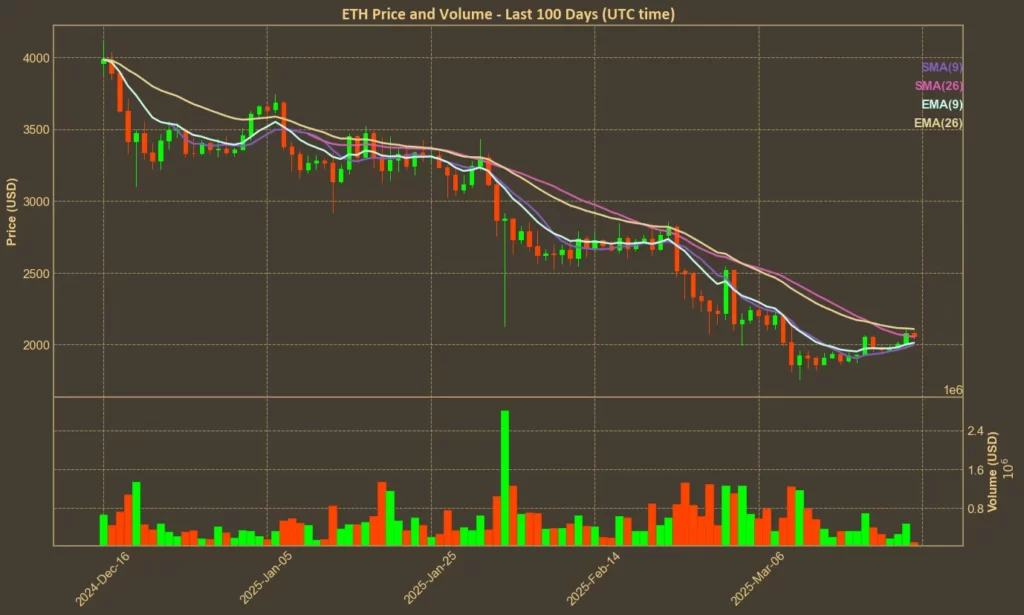
SMA & EMA: Bearish
Ethereum is trading below both its 26-day moving averages. The EMA(26) at 2,109 and SMA(26) at 2,054 both sit above current prices, suggesting resistance ahead. Shorter-term averages like the 9-day EMA (2,013) and SMA (1,999) are closer, showing potential for a near-term test of resistance. Until ETH can break above these levels, the overall signal remains bearish.
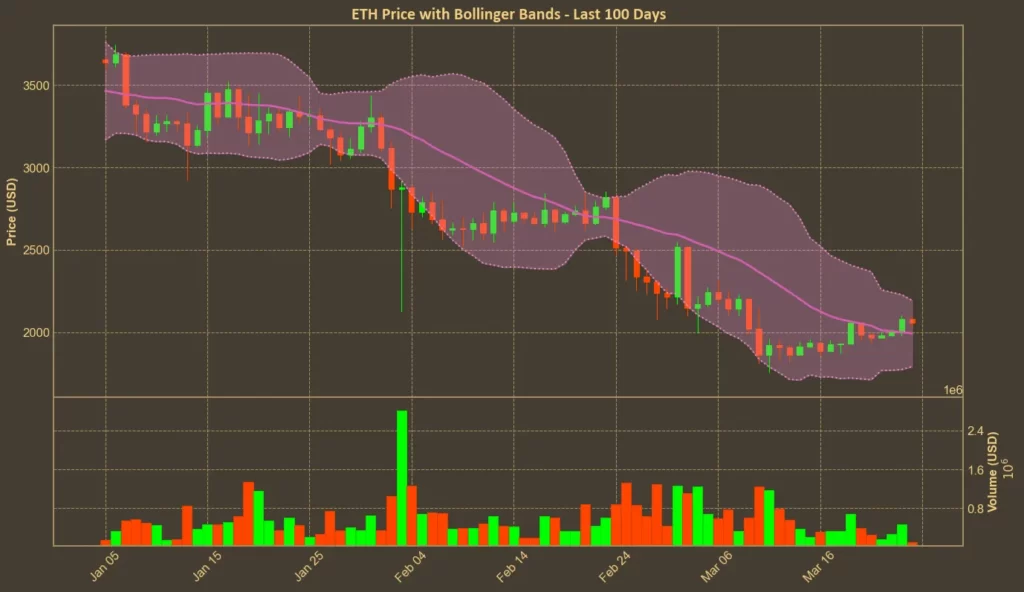
Bollinger Bands: Cautious
With Ethereum currently near the mid-range between its upper band (2,194) and lower band (1,792), the price doesn’t signal a strong overbought or oversold condition. The spread between the bands, however, shows heightened volatility. A breakout in either direction is still possible, but for now, the market seems undecided.
Trend & Volatility Indicators
ADX: Weak Trend
At 33, the Average Directional Index suggests that Ethereum’s previous trend has lost strength. A week ago it was at 43, signaling a strong trend, but that momentum has cooled down. This shift aligns with the recent sideways price movement.
ATR: Decreasing Volatility
The Average True Range, now at 127.0, has declined from 157.0 a week ago. Lower ATR usually reflects less aggressive price swings. While this may be welcomed by longer-term holders, it also suggests a lack of momentum in either direction.
AO: Improving
The Awesome Oscillator remains in negative territory at -167.0 but has improved from -411.0 last week. This indicates bearish momentum is fading. While not yet bullish, it may reflect a turning point in sentiment and trend confirmation.
VWAP: Bearish
The Volume Weighted Average Price today is 2,791 – well above current price. This indicates that Ethereum is still trading below its volume-adjusted fair value, a sign that sellers have dominated in recent sessions.
Relative Performance
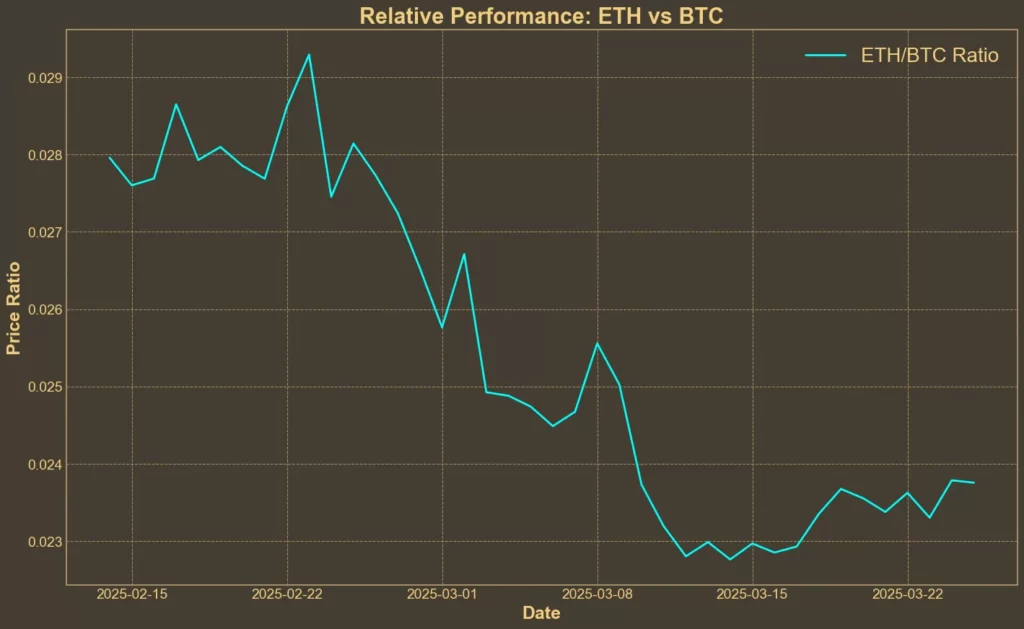
Comparison Against BTC: Stable
The ETH/BTC ratio has increased slightly over the past week but is still down more than 13% over the past month. This shows Ethereum is holding steady against Bitcoin in the short term but still hasn’t recovered its relative strength. The ratio suggests no clear breakout or breakdown compared to the market leader.
Outlook and Market Sentiment
Some recent developments are starting to shift investor focus back to Ethereum. The delayed Pectra upgrade is one of the most watched events, as it promises to bring improvements like gas fee flexibility and staking changes. While the postponement has disappointed some, testing on the Hoodi network begins this week and could trigger stronger confidence if successful.
Additionally, daily ETH burns due to transaction fees have hit historic lows, a concerning sign for network activity. However, exchange reserves are also at a 10-year low, showing that investors might be moving their assets off trading platforms for long-term storage or staking. This typically reduces selling pressure.
Institutional interest remains present. Fidelity’s move to launch an Ethereum-based money market fund is another signal that big players still see value in Ethereum as an infrastructure asset. However, this doesn’t guarantee a price recovery in the short term.
Conclusion
Technical indicators show mixed results, but several are starting to point toward early recovery signs. RSI and MFI reflect improving momentum, while volatility and trend strength are weakening – both common in consolidation phases. The Awesome Oscillator shows bearish pressure may be subsiding, yet Ethereum still trades below key moving averages and VWAP, suggesting resistance remains.
As always, technical analysis has its limitations. It doesn’t account for unexpected market events, policy shifts, or broader macroeconomic changes. With Ethereum’s near-term price action hovering around psychological support, the next move will likely depend on investor reaction to upcoming Pectra testnet results and broader market stability.


