Ethereum is in a difficult phase, underperforming compared to major cryptocurrencies. While Bitcoin, XRP, BNB and Solana have experienced significant gains over the past year, Ethereum is currently valued 3% lower than it was a year ago – despite securing its own ETF in mid-2024.
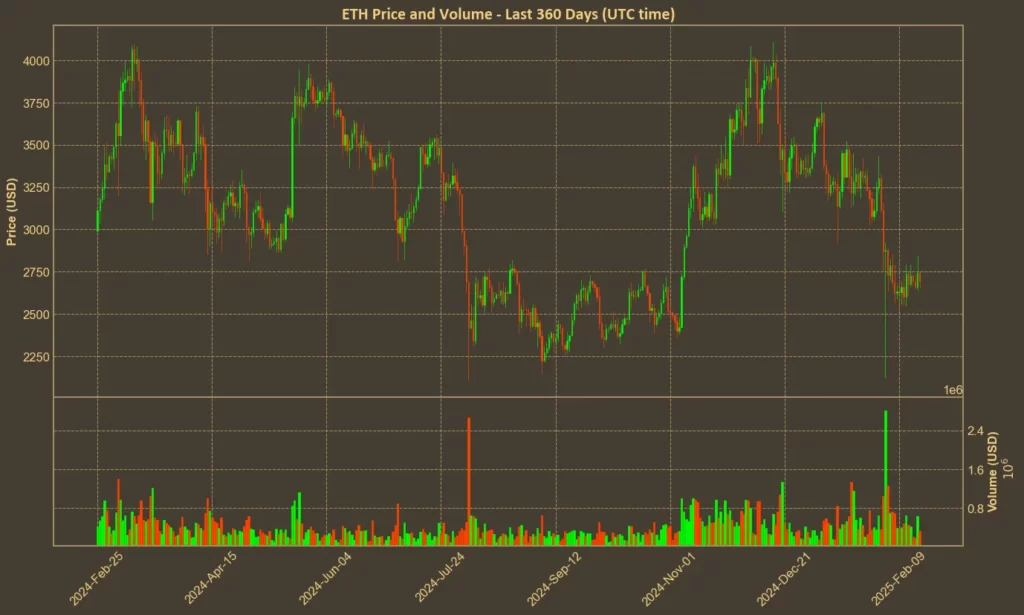
Recent price action has not inspired confidence either. Over the past month, Ethereum’s value has dropped nearly 16%. While it remains the second-largest cryptocurrency by market capitalization, standing at a solid $318 billion with no immediate threats to its position, XRP is approaching half of ETH’s market cap.
Table of Contents
Momentum Indicators
RSI: Neutral
The Relative Strength Index (RSI) tells whether Ethereum is overbought or oversold. With a 14-day RSI currently at 41, Ethereum is in a neutral zone, slightly leaning towards being oversold. The short-term RSI of 45 indicates a balanced momentum without clear overextension.

MFI: Stable
The Money Flow Index (MFI) combines price and volume to evaluate buying and selling pressure. Ethereum’s 14-day MFI stands at 43, showing stable conditions without significant shifts in trading volume influencing the price.
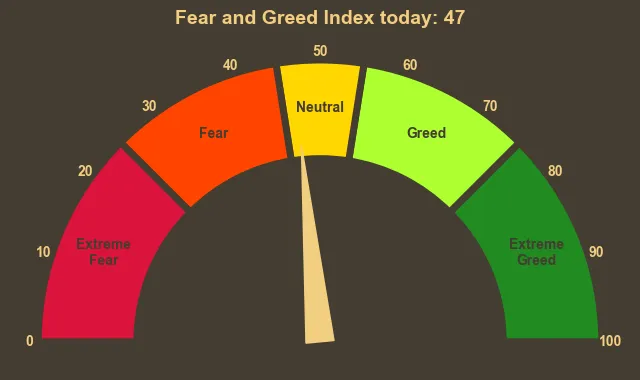
Fear & Greed Index: Neutral
The Fear & Greed Index for the broader crypto market is at 47, suggesting a balanced sentiment. This stability indicates that investor emotions are equally split between fear and greed, contributing to a relatively steady market behavior for Ethereum.
Moving Averages
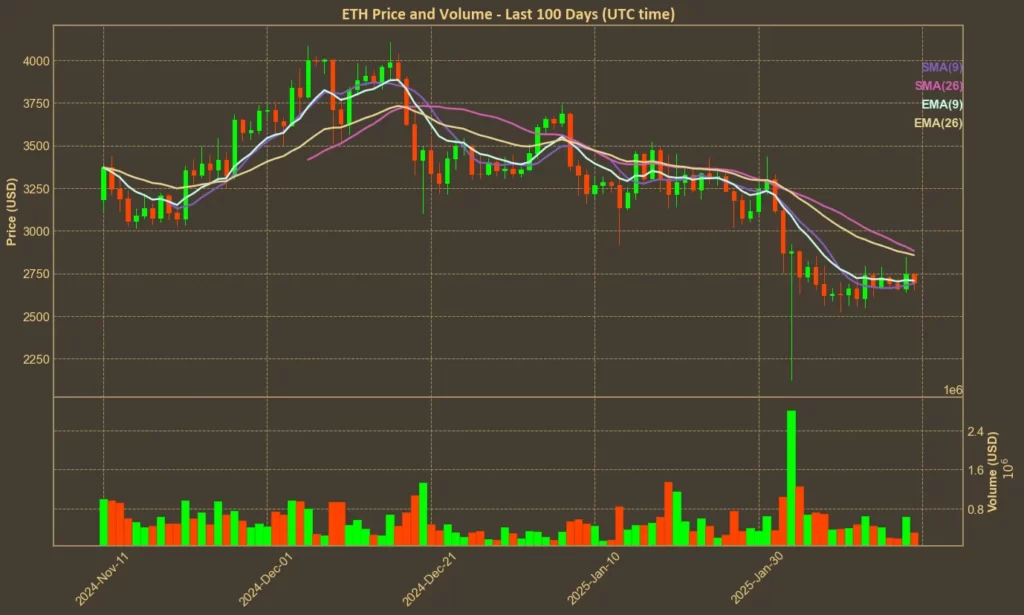
SMA & EMA: Cautious
Ethereum’s Simple Moving Average (SMA) and Exponential Moving Average (EMA) provide insights into price trends. The 9-day SMA is at 2,690, while the 9-day EMA is slightly higher at 2,709. Both the 26-day SMA and EMA are at 2,882 and 2,858, respectively. These figures suggest a cautious outlook, with short-term averages below longer-term ones, hinting at potential resistance.
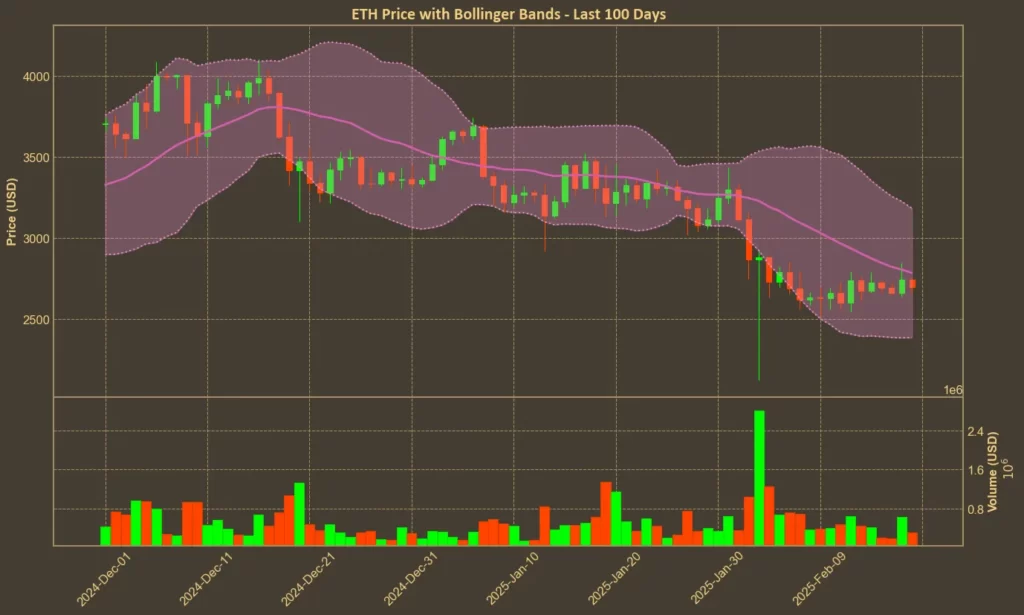
Bollinger Bands: Volatile
Bollinger Bands measure market volatility and potential price breakouts. Ethereum’s upper band is at 3,184, and the lower band is at 2,387. Currently trading near the lower band indicates increased volatility and the possibility of Ethereum being oversold, which could lead to a price rebound or further decline.
Trend & Volatility Indicators
ATR: Decreasing Volatility
The Average True Range (ATR) is 183, down from 189 the previous day and 213 a week ago. This decline suggests that Ethereum’s price volatility is decreasing, pointing towards a more stable trading environment.
AO: Negative Momentum
The Awesome Oscillator (AO) is at -273, improving slightly from -295 yesterday and -460 a week ago. Although still negative, the upward movement in the AO indicates weakening bearish momentum and potential stabilization in Ethereum’s price.
VWAP: Below Average
The Volume Weighted Average Price (VWAP) for today is 3,297. Ethereum is currently trading below this average, suggesting that the price is lower than the average traded price when considering volume, which may imply bearish pressure.
Relative Performance
Comparison Against BTC: Short-Term Improvement
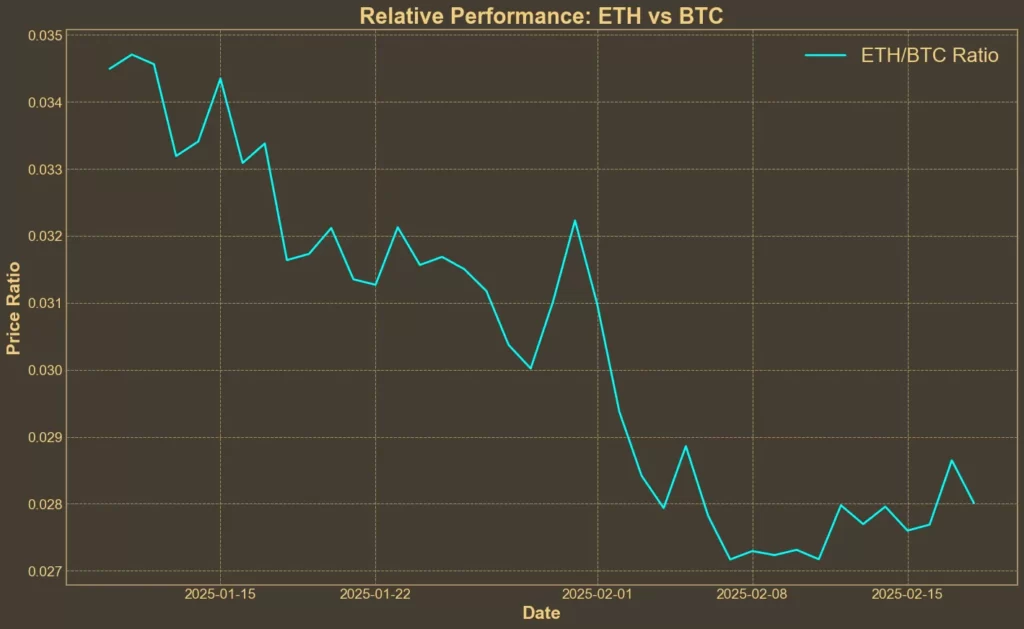
In the long term, Ethereum has lagged behind Bitcoin and other leading assets. However, over the past week, the ETH/BTC pair has risen by 3%, signaling a slight recovery. Yet, this modest gain pales in comparison to the 13% decline Ethereum has suffered over the past month.
Hope in the Pectra Upgrade?
Ethereum’s technical indicators paint a mixed picture. However, the upcoming Pectra upgrade could serve as a much-needed catalyst for a shift in sentiment.
Set to roll out on the Holesky testnet on February 24 and Sepolia on March 5, the Pectra upgrade is designed to improve Ethereum’s efficiency and scalability. A crucial aspect of this upgrade is doubling the data blob capacity for rollups, which is expected to reduce transaction fees and improve Layer-2 network performance. Additionally, the introduction of “gasless” transactions – where third parties can cover gas fees – could make Ethereum more user-friendly and accessible.
These improvements could drive renewed interest in Ethereum, especially from institutional investors. ETF inflows have already picked up, and approval of staking-based Ethereum ETFs could further boost demand. If institutions see Ethereum as an increasingly efficient and scalable network, they may allocate more capital, potentially reversing the recent price struggles.
Conclusion
Ethereum’s technical indicators remain mixed. While momentum indicators like RSI and MFI show neutrality, AO suggest a strong trend with declining bearish momentum. Moving averages and Bollinger Bands highlight cautious trading and potential volatility. Relative performance against Bitcoin shows some improvement in the short term but remains weak over the past month.
The Pectra upgrade could provide a much-needed boost, improving Ethereum’s scalability and usability. While its long-term impact appears bullish, Ethereum’s short-term performance will remain largely influenced by broader market trends and macroeconomic factors.
Need a quick and easy way to see what’s happening in crypto over the next few days? Check out our Crypto Events Calendar!


