Ethereum has been under pressure for months now. After struggling near the $2,000 level in late March, the price dropped sharply and is now hovering around $1,600. That’s nearly 16% down over the last month and more than 50% down since the start of the year. Compared to where it stood during the ETF excitement last summer, this is a completely different picture.

Ethereum still holds the #2 spot by market cap, but it’s not attracting the same kind of short-term bullish energy that carried it through parts of 2024. Tether now commands almost three-quarters of Ethereum’s market cap, and XRP isn’t far behind, closing in on two-thirds. Institutional inflows are weaker, staking-related ETFs are still delayed, and large outflows from DeFi and stablecoins point to falling activity. Technically, the momentum isn’t gone entirely – but it’s clearly slowing down.
Table of Contents
Momentum Indicators
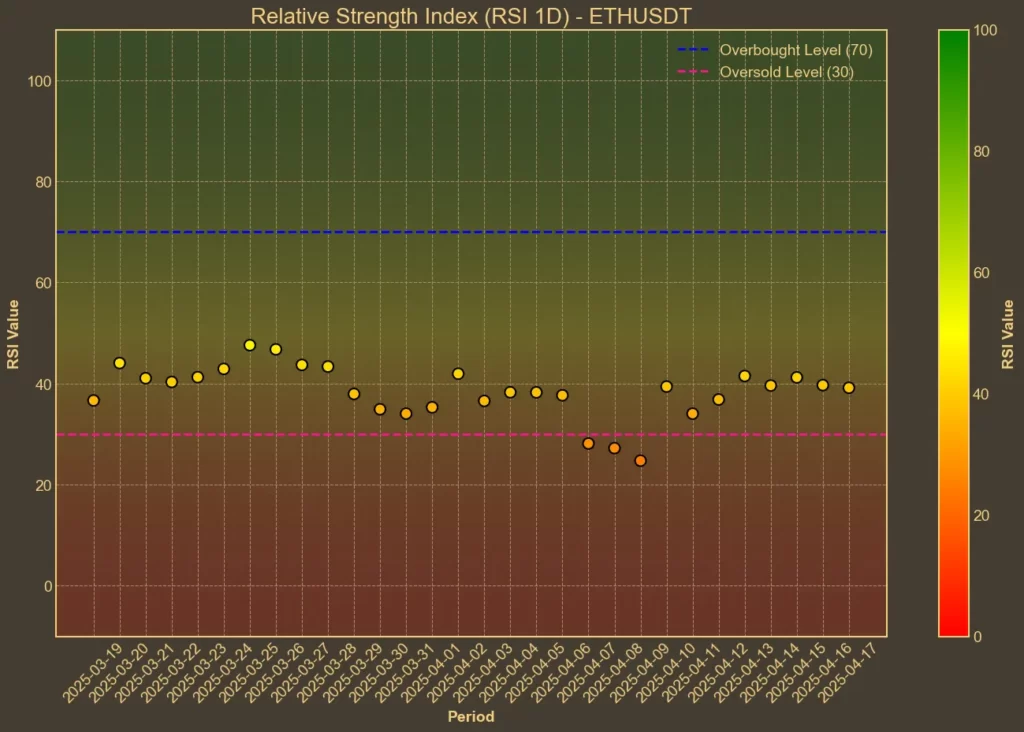
RSI: Neutral
RSI helps identify whether Ethereum is overbought or oversold. Right now, RSI(14) sits at 41. That’s a recovery from 34 one week ago, but it’s still below 50 – meaning the bears haven’t fully left. The short-term RSI(7) is higher at 45, which could suggest a slight rebound attempt. This isn’t a strong bullish signal, but it shows the selling pressure is cooling down.

MFI: Oversold
MFI combines price and volume data to assess buying and selling pressure. At 29, it’s in oversold territory. The gradual increase from 26 last week to 29 today could mean buyers are starting to step in – but there’s no real confirmation yet. If volume rises while MFI climbs, that would be more convincing.
Fear & Greed Index: Fear
Today’s reading of 30 confirms what many investors are feeling – uncertainty and hesitation. That number dropped from 45 just four days ago, suggesting the broader market isn’t ready to turn bullish. Fear doesn’t always lead to selling, but it keeps new buyers away.

Read also: How To Use Crypto Fear and Greed Index To Your Advantage?
Moving Averages
SMA & EMA: Bearish
Both short-term and mid-term moving averages are currently pointing down. Ethereum is below all major averages, including the SMA(9) at 1599 and EMA(9) at 1610. The longer-term SMA(26) and EMA(26) are sitting much higher – 1756 and 1736 respectively – showing how far the price has dropped. This setup puts technical pressure on any recovery attempt.

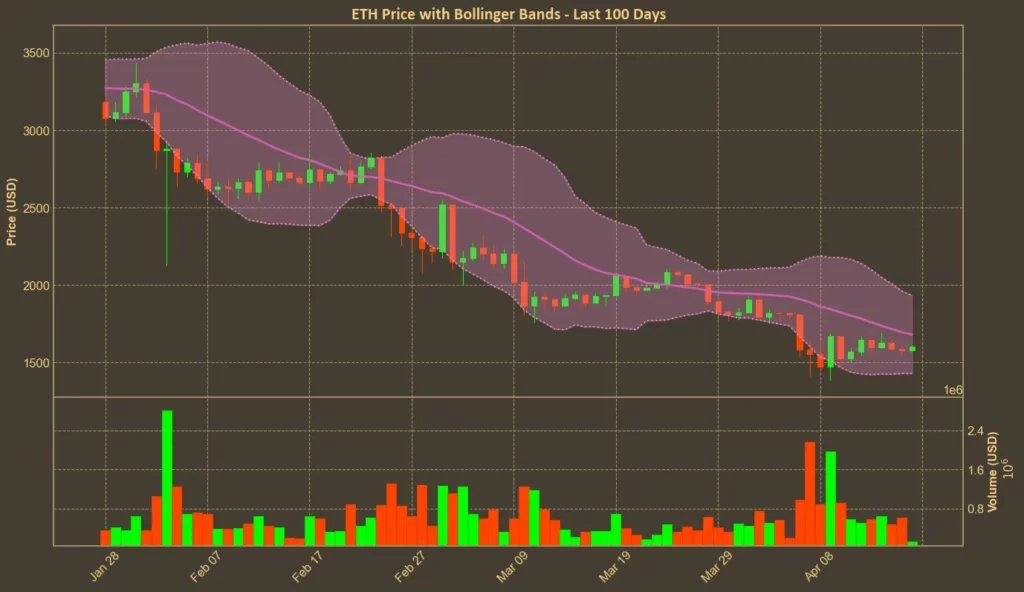
Bollinger Bands: Increased Volatility
Ethereum is now in the lower half of its Bollinger Bands, currently sitting closer to the bottom band at 1427 than the upper one at 1932. That suggests the asset is still being sold aggressively, but also that it might be entering a region where short-term bounces happen. Still, it’s too early to call a reversal.

Trend & Volatility Indicators
ADX: Weakening Trend
ADX has dropped from 37 a week ago to 33 today. That’s still above 25, so there is some trend strength – but it’s fading. The market appears to be losing conviction in either direction, which makes the current setup less reliable for swing trades.
ATR: Decreasing Volatility
ATR is down from 150 last week to 122 today. That drop usually means the wild price swings are calming down, but in this case, it also reflects less participation. Lower ATR isn’t always a sign of stability – it can also mean indecision.
AO: Bearish Momentum
Awesome Oscillator shows ongoing bearish momentum, though it’s slowing down slightly. Today’s reading of -196 is better than -312 a week ago, but still deep in negative territory. Buyers haven’t stepped in with enough force to flip the trend yet.
VWAP: Bearish
VWAP is far above the current price – sitting at 2401. This large gap shows Ethereum is trading well below volume-weighted expectations. Unless the price starts closing that distance, it’s hard to call the trend bullish.
Relative Performance
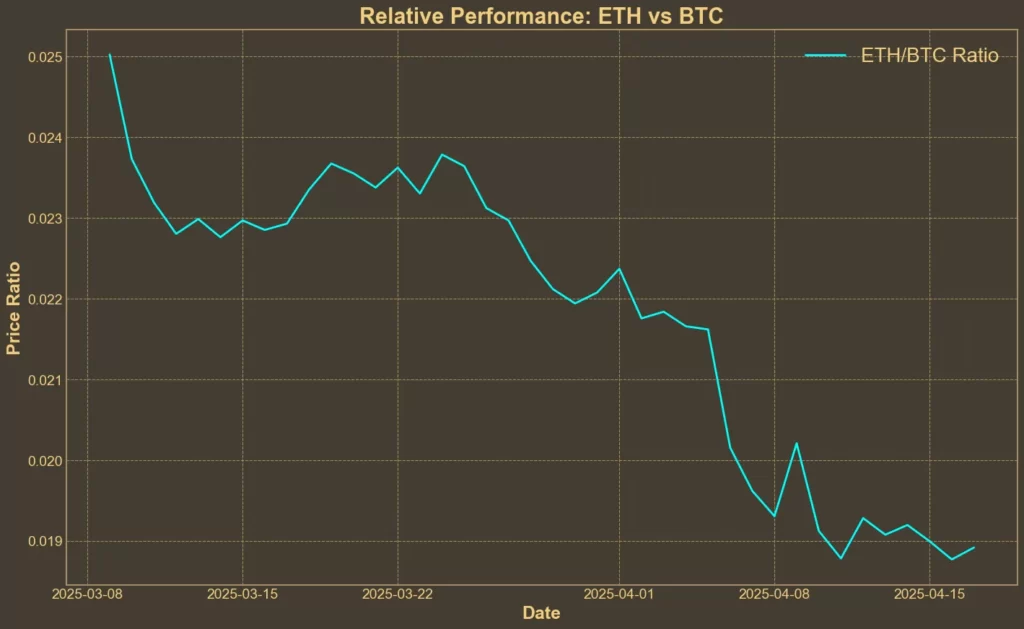
Comparison Against BTC: Weak
ETH/BTC is 0.0189, down over 20% from a month ago. While the decline has slowed over the last week, Ethereum continues to underperform. The ratio is relatively stable now, but it’s stabilizing at a low level. That’s not strength – it’s just pause.

Ethereum is also lagging behind other major altcoins. The SOL/ETH ratio is near record highs, and despite Solana gaining 15% over the past week, it’s still trading around $135 – highlighting just how weak Ethereum’s relative performance has become.
Recent Developments
There are a few stories worth mentioning, but none of them have given Ethereum a strong push yet. Bitwise’s new ETP listings on the London Stock Exchange increase institutional exposure, but the actual inflows haven’t spiked. Options trading on spot ETFs has been approved, but staking-related ETFs are still facing SEC delays.
On the technical side, the Pectra upgrade – scheduled for May 7 – is getting closer. It’s meant to improve validator efficiency and support new Ethereum Improvement Proposals. That could help boost confidence long term, but the short-term market isn’t reacting much.
Read also: Ethereum Pectra Upgrade Launching on May 7th – Here’s What It Changes
Final Thoughts
Most technical indicators are either neutral or leaning bearish. Momentum is slowing, volatility is falling, and moving averages are stacked above the current price. Ethereum isn’t crashing – but it’s clearly struggling.
The price might find support around the lower Bollinger Band, but there’s no strong reversal signal yet. Until something shifts in volume, institutional interest, or ETF approvals, the chart doesn’t suggest a clear breakout.
Read also: This Year’s Best-Performing ETF? It’s Not What You’d Expect


