Ethereum has been pushing upwards with strength not seen in months. After weeks of flat trading, ETH has climbed over 48% in the last month and nearly 9% in just the past week, currently sitting just below $2,700. The rally accelerated after Ethereum cleared resistance at $2,550, a level that had capped multiple breakout attempts. That line now acts as technical support, with volume and investor confidence continuing to build.
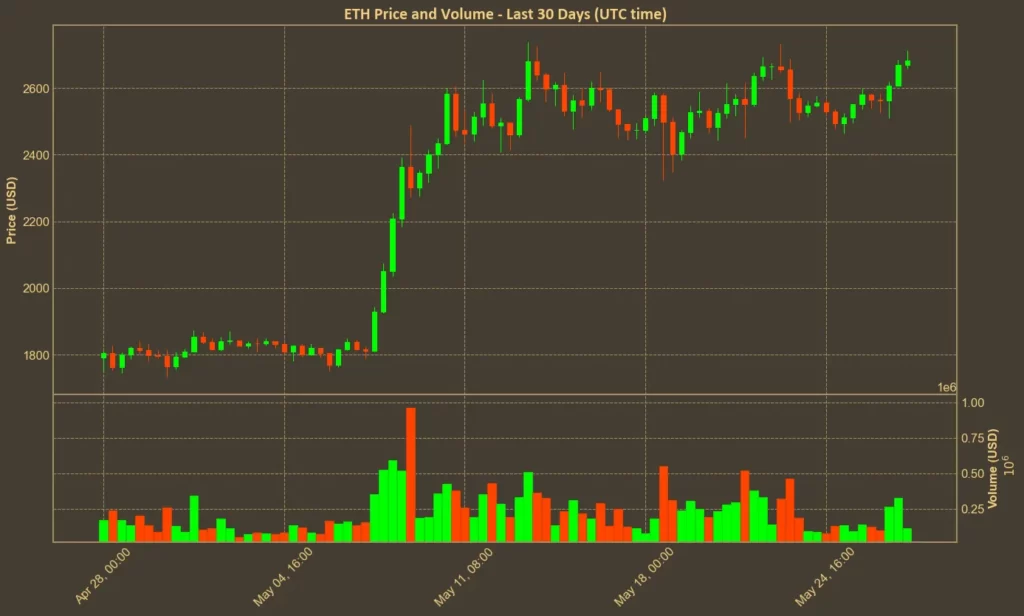
A surge in institutional demand is the main reason behind this move. ETH spot ETFs, particularly BlackRock’s ETHA fund, are attracting hundreds of millions in inflows. Additionally, SharpLink Gaming announced the adoption of Ethereum as a treasury asset, committing to buy over $400 million worth.
But institutional money can be just as quick to retreat if market signals flip. That’s why technical indicators still matter.
Read also: Fusaka Upgrade: What’s Next for Ethereum After Pectra?
Table of Contents
Click to Expand
Momentum Indicators
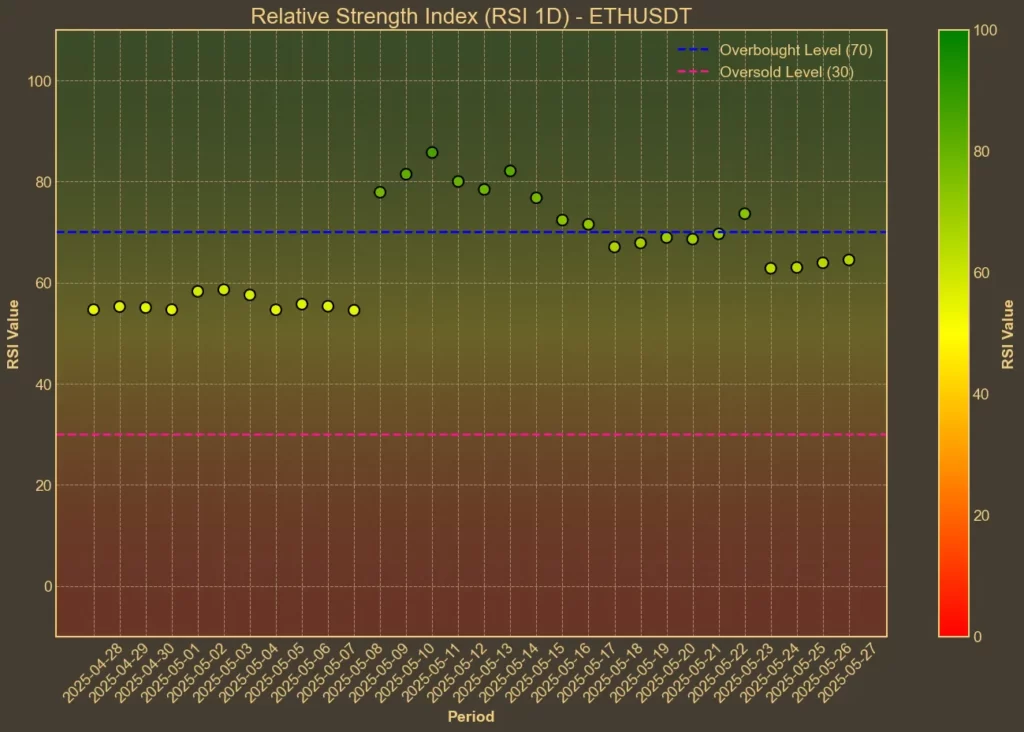
RSI: Near Overbought
RSI measures how strongly price moves in either direction. Right now, both long- and short-term RSI values are pushing above typical thresholds. RSI(14) is at 69, up from 64 yesterday. RSI(7) hit 71, compared to 60 the day before. These levels suggest increasing pressure but also raise the chance of a short-term cooldown.
MFI: Neutral
The Money Flow Index, which factors in trading volume, offers a more neutral read. MFI(14) has slipped to 62 from 64 yesterday and was 74 just a week ago. The pullback, despite higher prices, could signal weakening conviction behind recent buying.
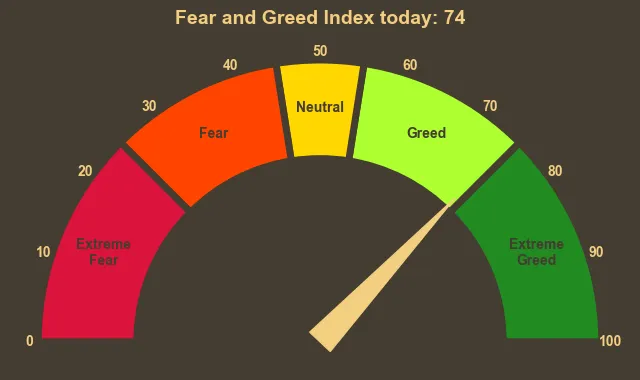
Fear & Greed Index: Greed
The broader market is showing strong risk appetite. The crypto Fear & Greed Index has hovered between 70 and 78 over the last week, standing at 74 today. High readings like these often precede corrections, though they don’t always trigger one immediately.
Moving Averages
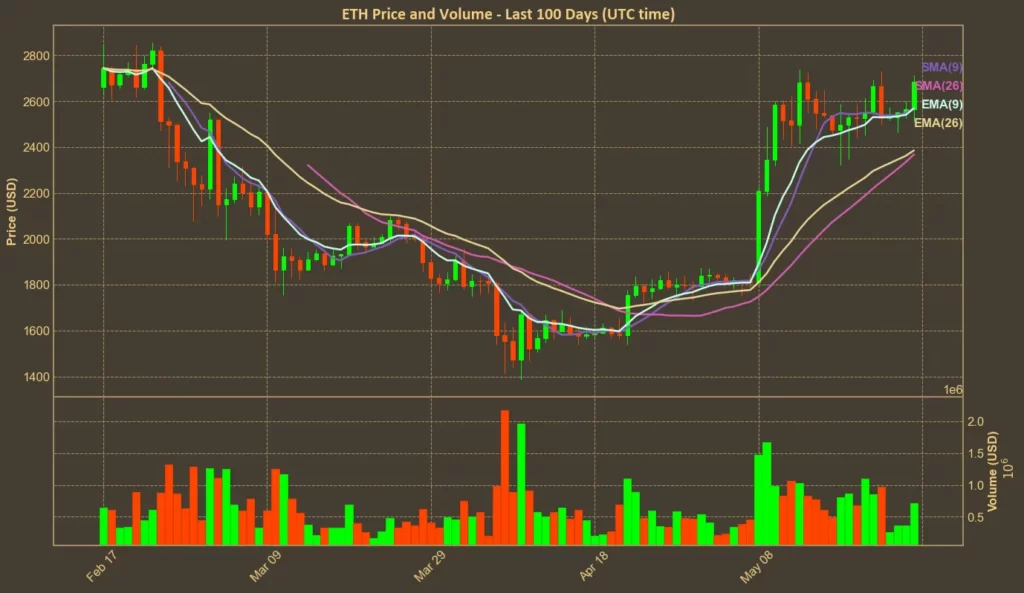
SMA & EMA: Bullish
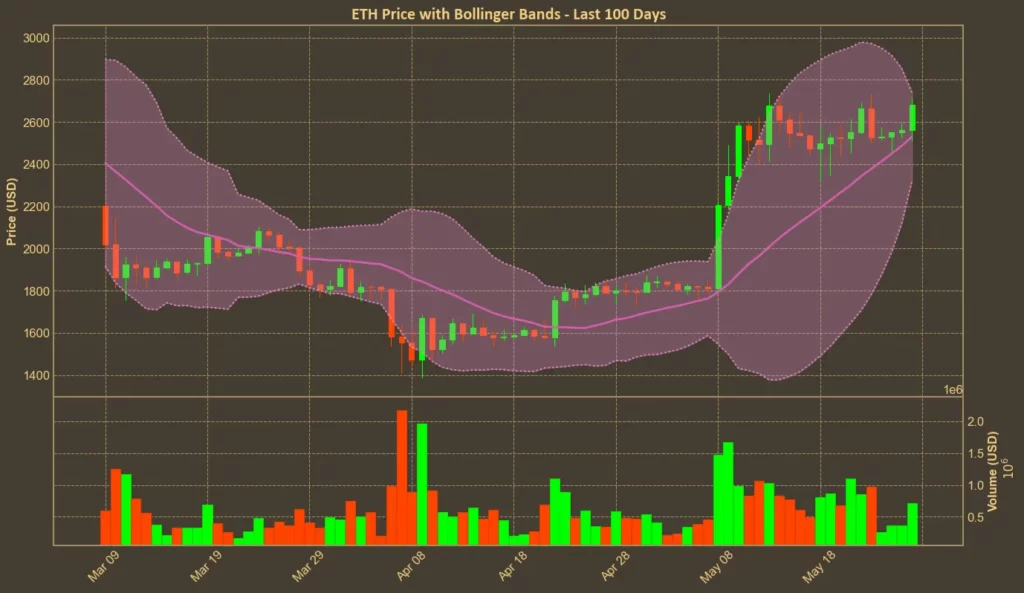
Short- and medium-term moving averages support the bullish outlook. ETH is comfortably above its 9-day SMA and EMA, both at $2,569. The longer 26-day moving averages (SMA at $2,367, EMA at $2,385) are also trailing behind the current price, confirming upward momentum.
Bollinger Bands: Overbought
With the upper band at $2,741 and the lower at $2,321, Ethereum’s current price sits close to the upper edge. That positioning often coincides with local tops or at least short-term resistance. Volatility is rising, and that usually means sharper moves are ahead – either way.
Trend & Volatility Indicators
ADX: Strong Trend
ADX is holding at 32. That indicates a clear trend is in place, though it’s not extreme. A reading over 25 already signals strength – the current value confirms that the bullish trend is established, but not yet overheated.
ATR: Stable Volatility
ATR sits at 151, with only minor fluctuations over the past week. This shows that while Ethereum is gaining, it’s not doing so in an unusually volatile way. That’s often seen as a sign of healthy, steady movement.
AO: Bullish, But Weakening
The Awesome Oscillator peaked last week and is now declining, dropping from 475 to 351. That shift could mean upward momentum is slowing. While it’s not yet a bearish signal, it does suggest the pace may not be sustainable without new catalysts.
VWAP: Bullish
Today’s VWAP is $2,107, well below the current price. This confirms that Ethereum is trading well above its average recent value, and buyers remain in control.
Relative performance
Comparison Against BTC: Bullish
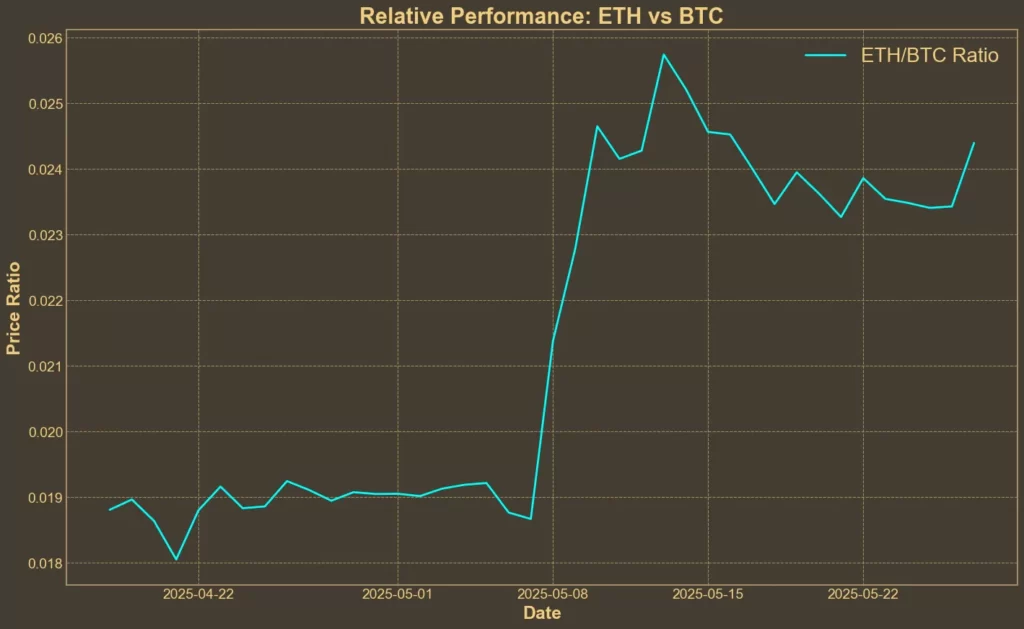
ETH is gaining ground against Bitcoin. The ETH/BTC ratio has risen over 3% in the last week and nearly 29% over the past month, although it earlier reached its 5-year lows.
What’s Next?
Most indicators are aligned in Ethereum’s favor – momentum, trend, and volume are all pointing upward. The break above $2,550 and sustained movement toward $2,700 confirm strength. However, some signs like RSI, Bollinger Bands, and AO suggest the move might be overextended in the short term.
Ethereum will face tough resistance between $2,750 and $2,850. If it breaks above that, the next target would be psychological – $3,000. But if more technical signals continue flashing warning signs, a short-term pullback wouldn’t be surprising either. Investors chasing this rally should weigh the growing optimism and positive news against the possibility of temporary corrections.
Read also: Avalanche (AVAX) Eyes $30 Amid FIFA Adoption and ETFs Progress


