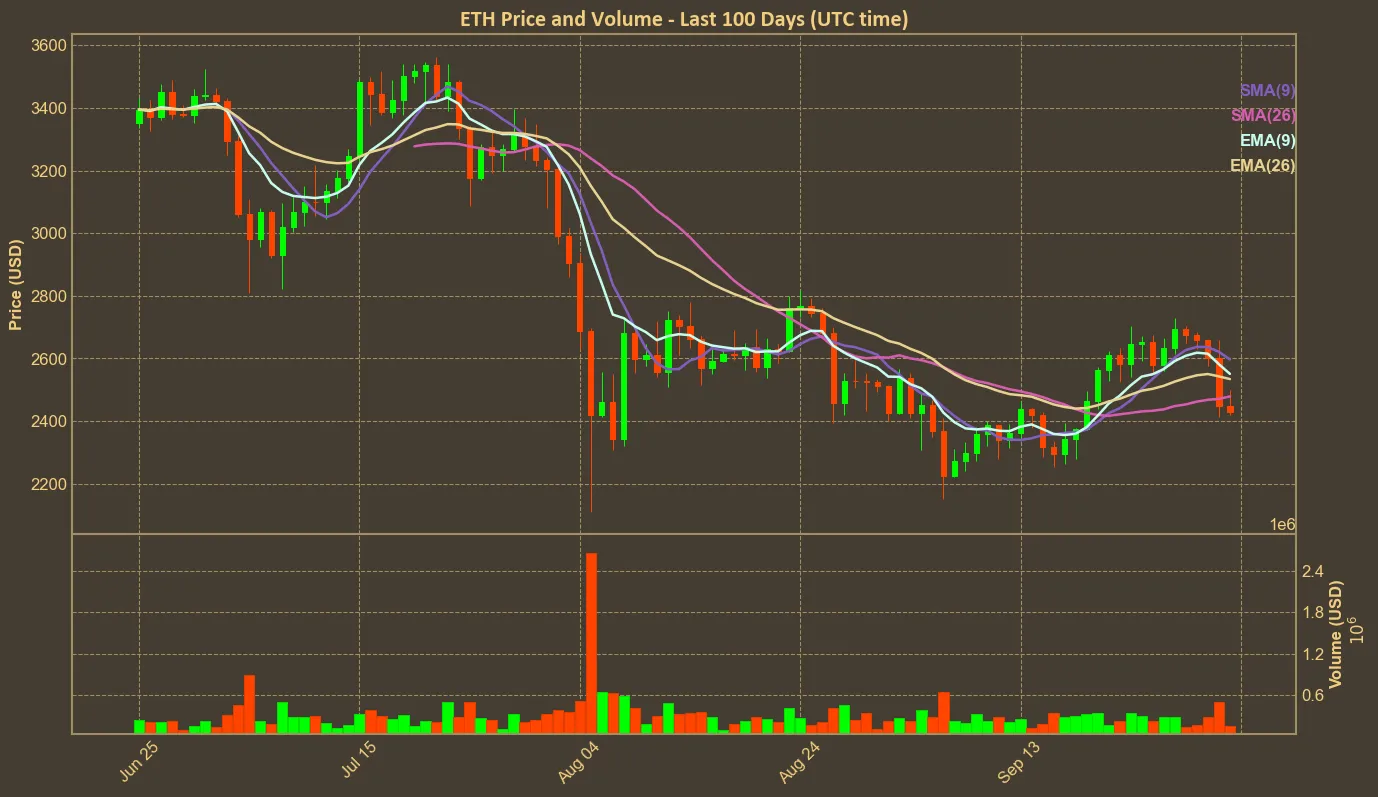
Ethereum’s market performance paints a complicated picture. Currently priced at $2,430, Ethereum has dropped over 5% since yesterday, largely driven by the escalation of conflict between Iran and Israel. The coin has also seen notable fluctuations over the past month. While it remains 46% higher than last year, it fell nearly 22% since last quarter, even after the introduction of ETFs at the end of July.

Current Market Dynamics
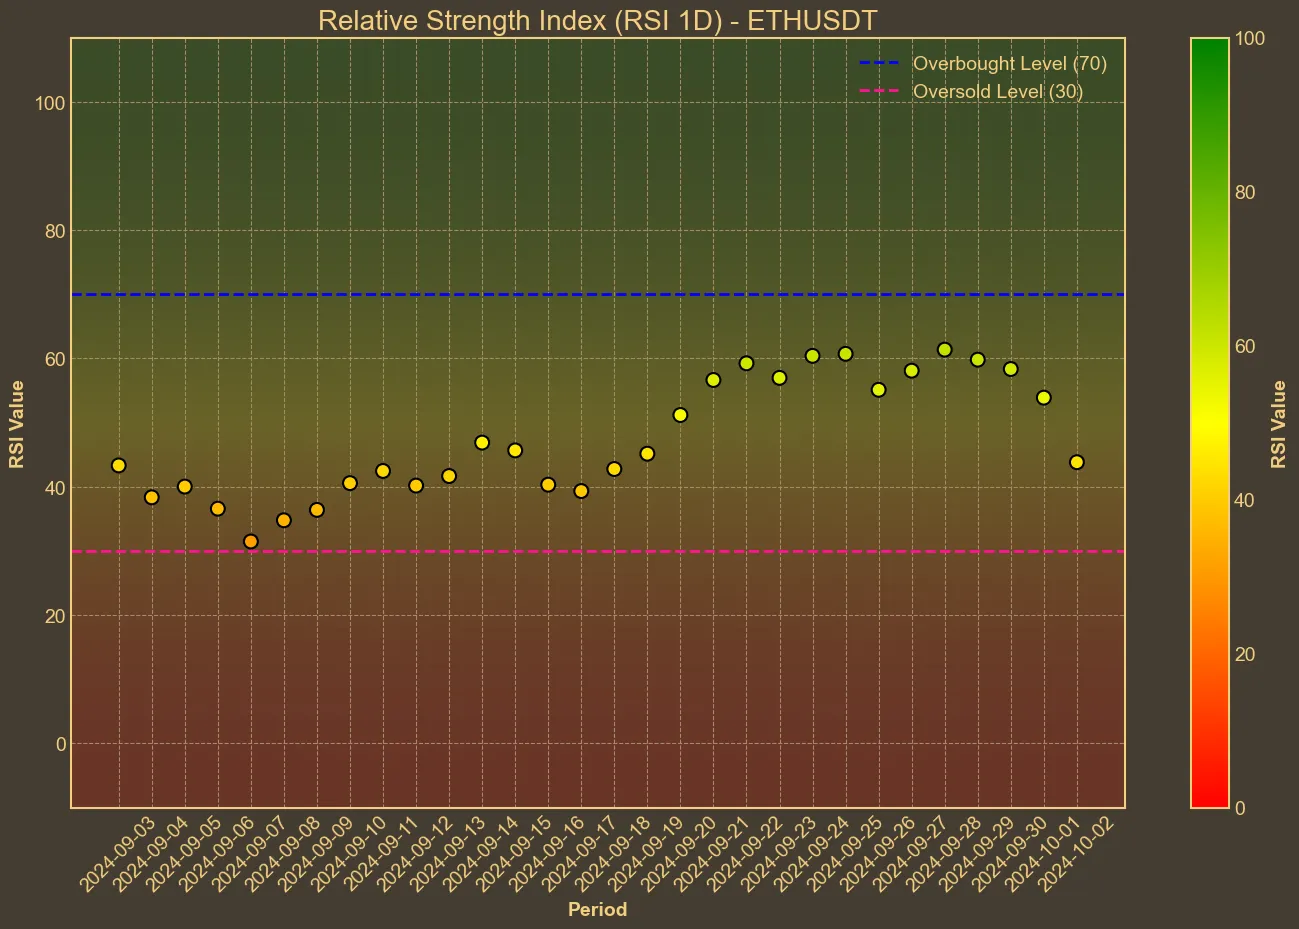
The technical indicators offer mixed signals. The Relative Strength Index (RSI) trending downward to 42 from 61 in just five days indicates that Ethereum is moving towards an oversold position.

Coupled with a consistent decrease in its Simple Moving Average (SMA) and Exponential Moving Average (EMA), it appears that bearish momentum is prevailing. Meanwhile, the Average Directional Index (AO) has also declined, further confirming this trend.

Looking at the Bollinger Bands, the price is closer to the lower band at 2267.0, suggesting limited upward movement and reinforcing the notion of current bearish sentiment. The Moving Average Convergence Divergence (MACD) is also below its signal line, another indicator of the potential for further price drops. Yet, the increased volume over the last week points to heightened market activity, which could entail more significant price moves on the horizon.
Broader Market Impact
Despite the recent dip, there are signs of strong institutional interest in Ethereum. From its use in on-chain digital commercial paper to the launch of new ETFs, Ethereum continues to advance in the decentralized finance space. However, these developments have not yet translated into short-term price gains.
The escalating conflict between Iran and Israel has also contributed to increased market volatility, pushing down cryptocurrency prices across the board. In such an unpredictable environment, relying solely on technical analysis may provide an incomplete picture. While Ethereum’s long-term outlook remains optimistic, further escalation in geopolitical tensions could drive prices even lower.
Conclusion
Ethereum’s technical indicators point toward a continuation of the bearish trend in the short term, but rising trading volumes and ongoing institutional interest provide a glimmer of optimism for the future. It’s important to remember that technical analysis is just one part of the equation, and broader economic and geopolitical factors can heavily influence market sentiment – especially during times of heightened uncertainty, such as now.


