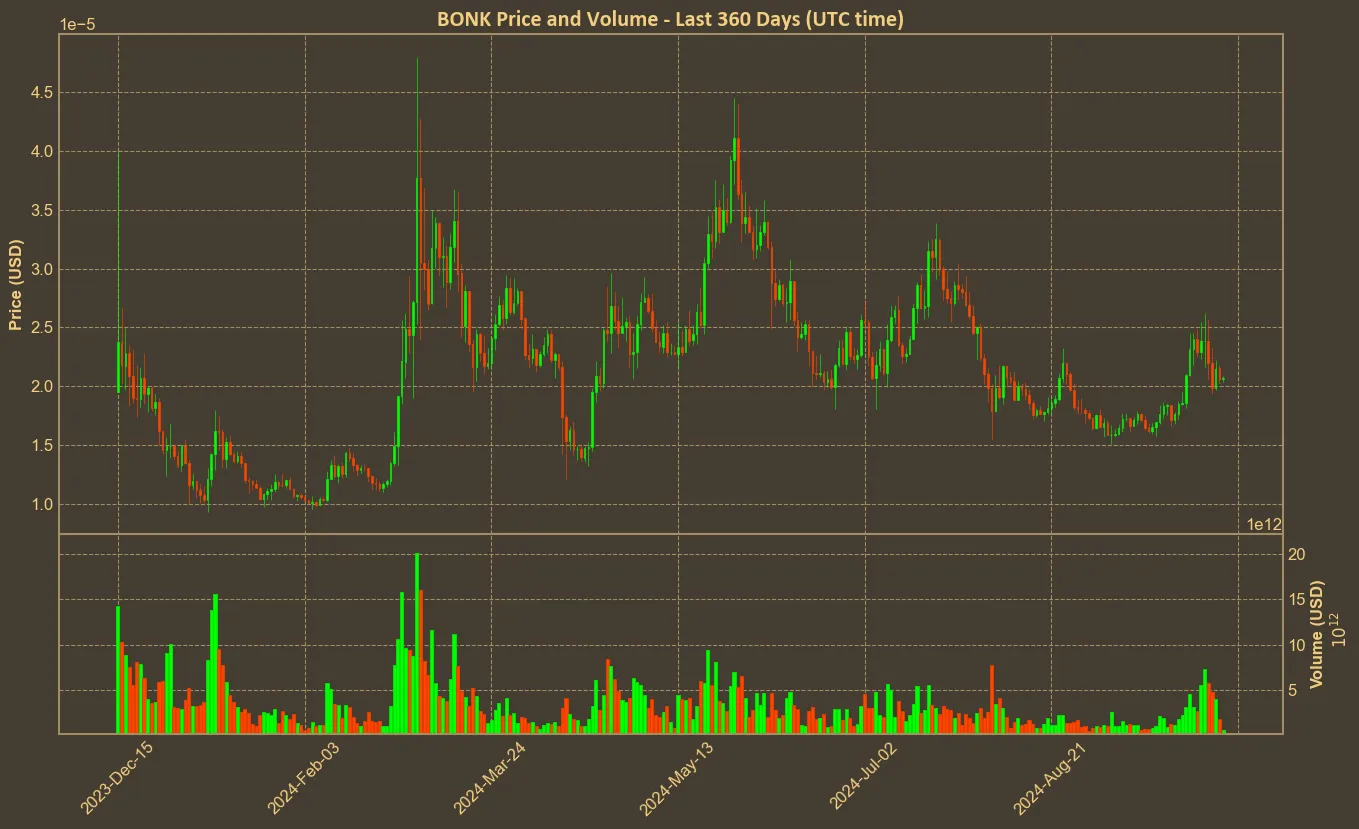
Bonk has shown intriguing behavior in the market, with some key indicators suggesting potentially significant changes on the horizon. Looking at recent trends, Bonk has exhibited a mix of upward momentum and some concerning dips, leading to divided sentiment among investors and analysts. Over the past month, Bonk experienced an impressive price increase of more than 25%. However, the long-term performance tells a slightly different story, marked by a downturn of nearly 16% since last quarter. Such a pattern hints at volatility, oscillating between phases of growth and contraction.

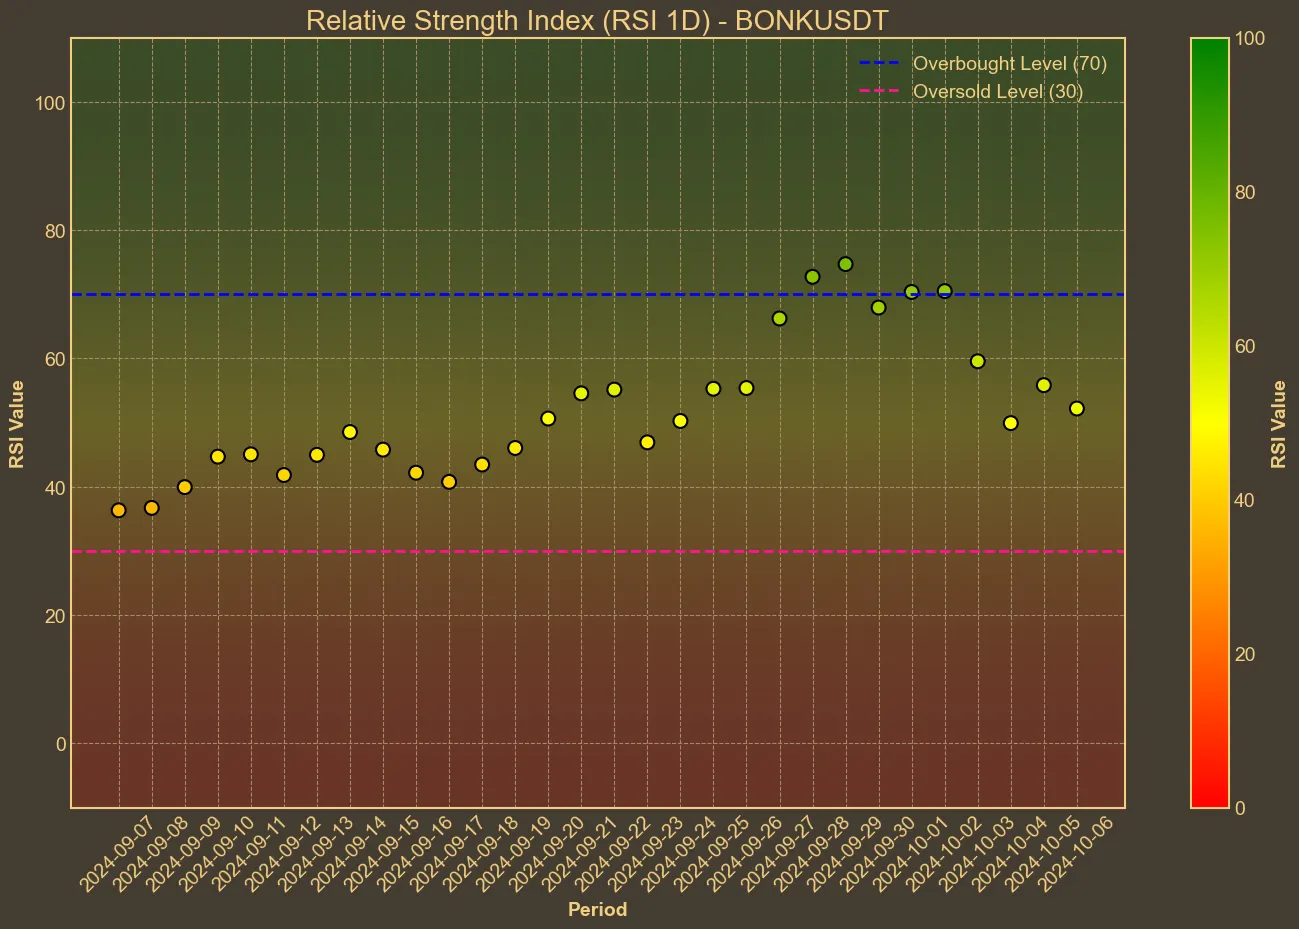
Despite recent dips over the last week and day, Bonk’s ongoing resilience is notable. Its current price stands at $0.00002060, reflecting a minor drop in the past 24 hours. Importantly, the Relative Strength Index (RSI), a key technical tool, hovers around the neutral 52 mark today. This indicates that Bonk isn’t currently in the overbought or oversold territory, suggesting a period of consolidation.

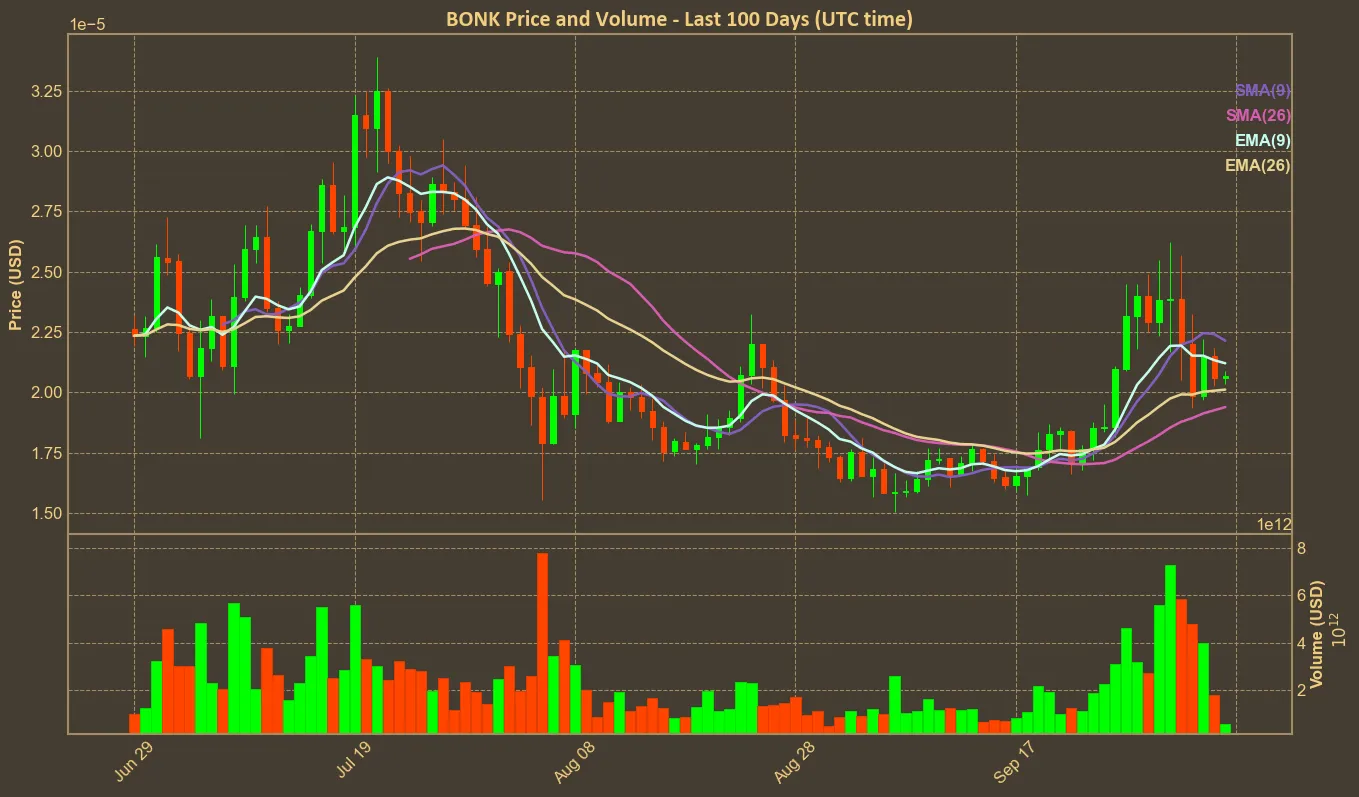
The Simple Moving Average (SMA) and Exponential Moving Average (EMA) remain steady, reinforcing the coin’s stability amidst broader market fluctuations. The technical indicators underline a period characterized by consolidation and setting the stage for a potential breakout in the coming weeks.

ILooking at market metrics such as the Awesome Oscillator (AO) and Moving Average Convergence Divergence (MACD), Bonk shows some signs of cautious optimism. Both indicators suggest a degree of positive sentiment building, but with vigilance required due to potential shifts. The Bollinger Bands (BB) highlight this, as they currently show a relatively wide margin, which suggests the price could either surge or retract.
This analysis leads me to believe that while Bonk has demonstrated traits of revival, reflected in its last month’s over 29% market cap growth, caution remains essential. Volume shifts have been significant, decreasing sharply, possibly indicating reduced active trading. This could mean cooling enthusiasm or a brief pause before further action. However, investors should be aware of the limitations of technical analysis – these indicators provide insight but cannot guarantee outcomes. While past performance suggests potential, they should complement, not dictate, investment decisions.


