The technical analysis of Dogecoin reveals intriguing insights about its current momentum and potential future performance. Examining the price trends and technical indicators provides a clearer picture of Dogecoin’s trajectory in recent months.
Table of Contents
Current Market Trends
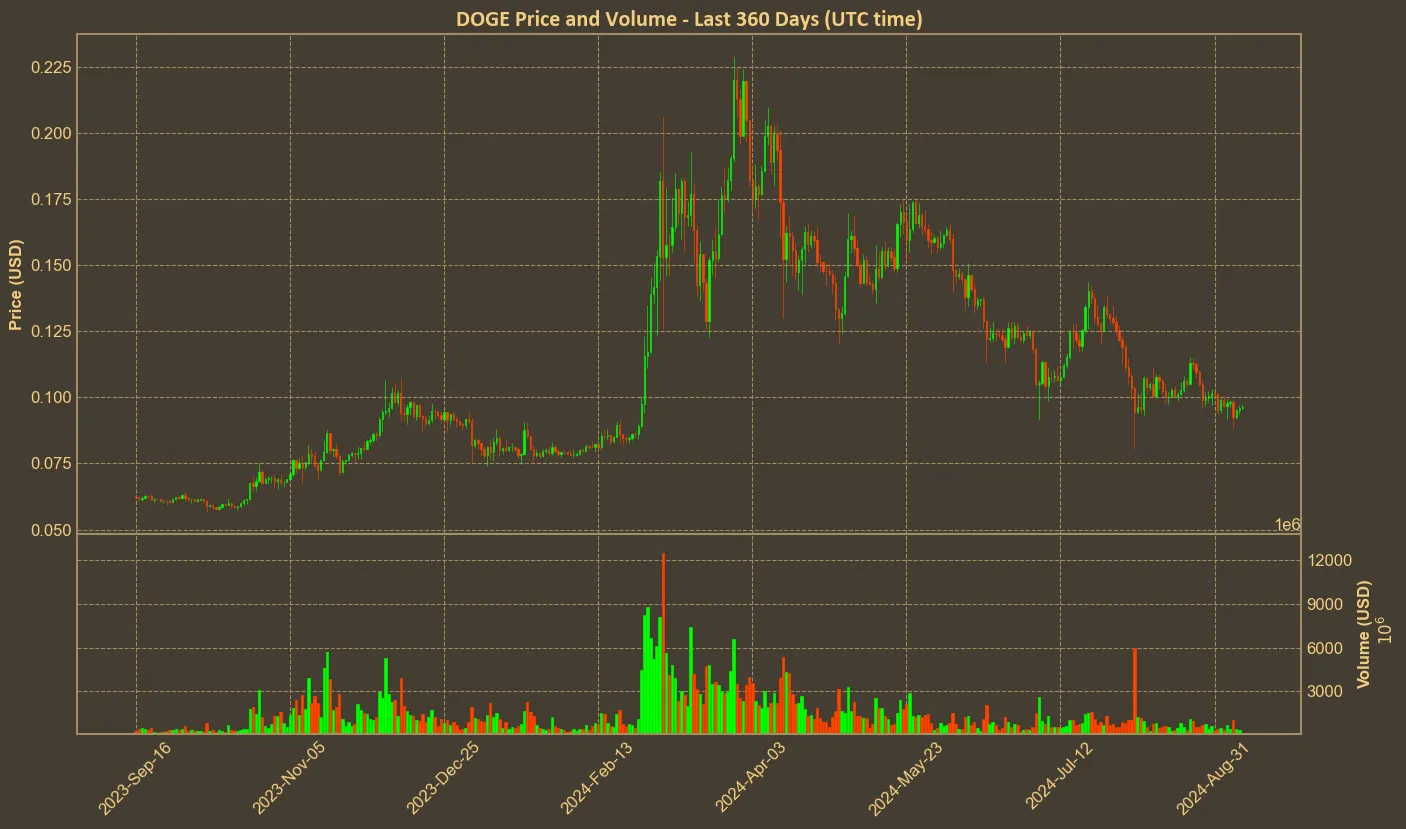
Dogecoin, currently ranked #9 in the cryptocurrency market, is priced at $0.0964. Notably, there has been a substantial price drop over the last quarter by 31.8%, signaling a bearish phase. However, the yearly change tells a different story, with an increase of 55.6%, suggesting that long-term investors still see value in holding DOGE.

Short-term trends indicate minor fluctuations, with slight decreases in the last hour and daily increases. The monthly downtrend, marked by a 6.9% decrease, contrasts with the modest weekly upward tick of 0.75%, showing that the coin has been relatively stable over the past week but has faced pressure over longer periods.
Technical Indicators
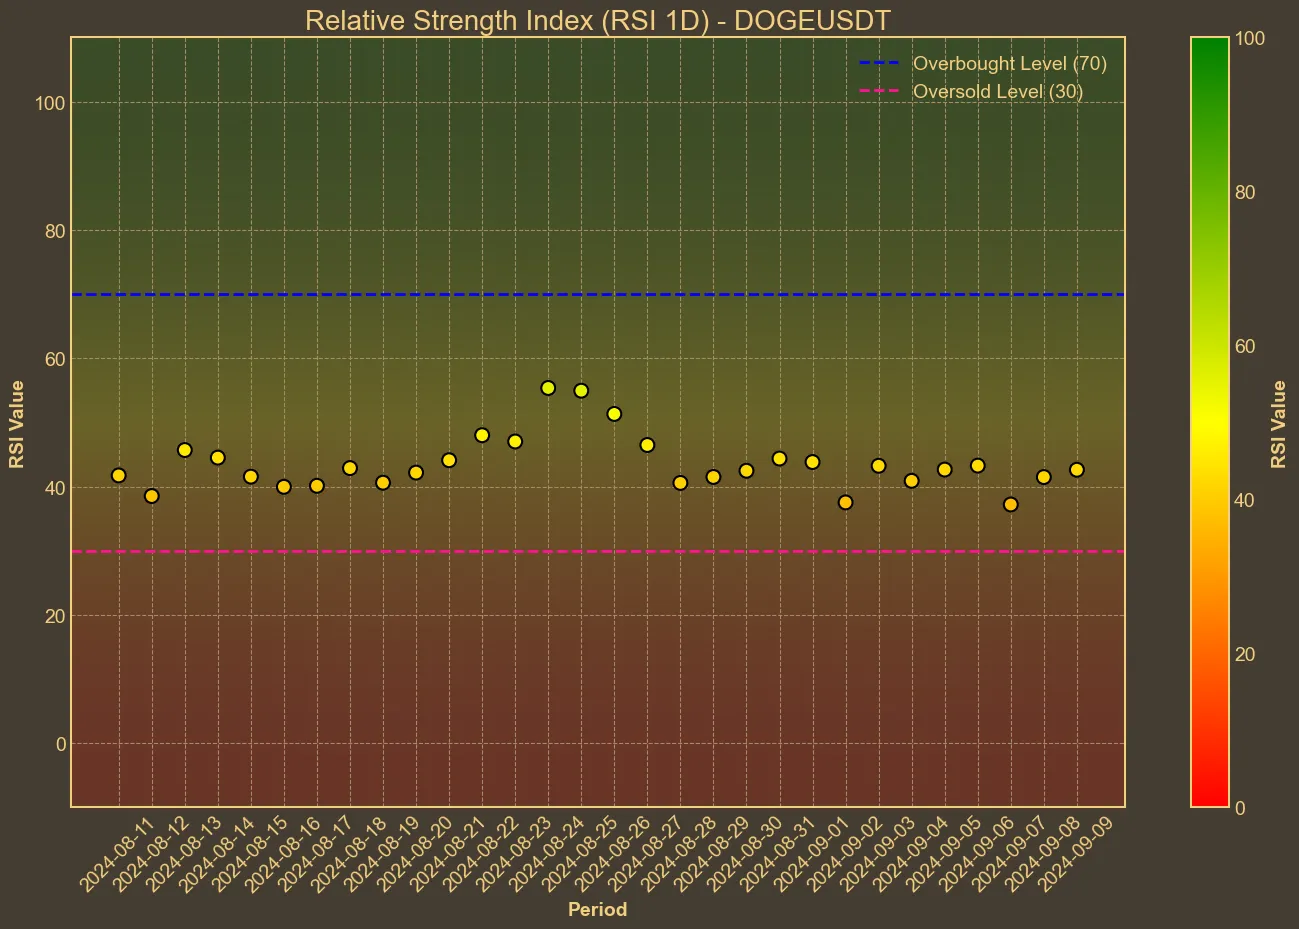
The Relative Strength Index (RSI) of 43 reflects a rather neutral position, suggesting neither an overbought nor oversold condition. The RSI has fluctuated between 37 and 43 over the past week, portraying a consistent near-stable perspective without strong buy or sell signals.

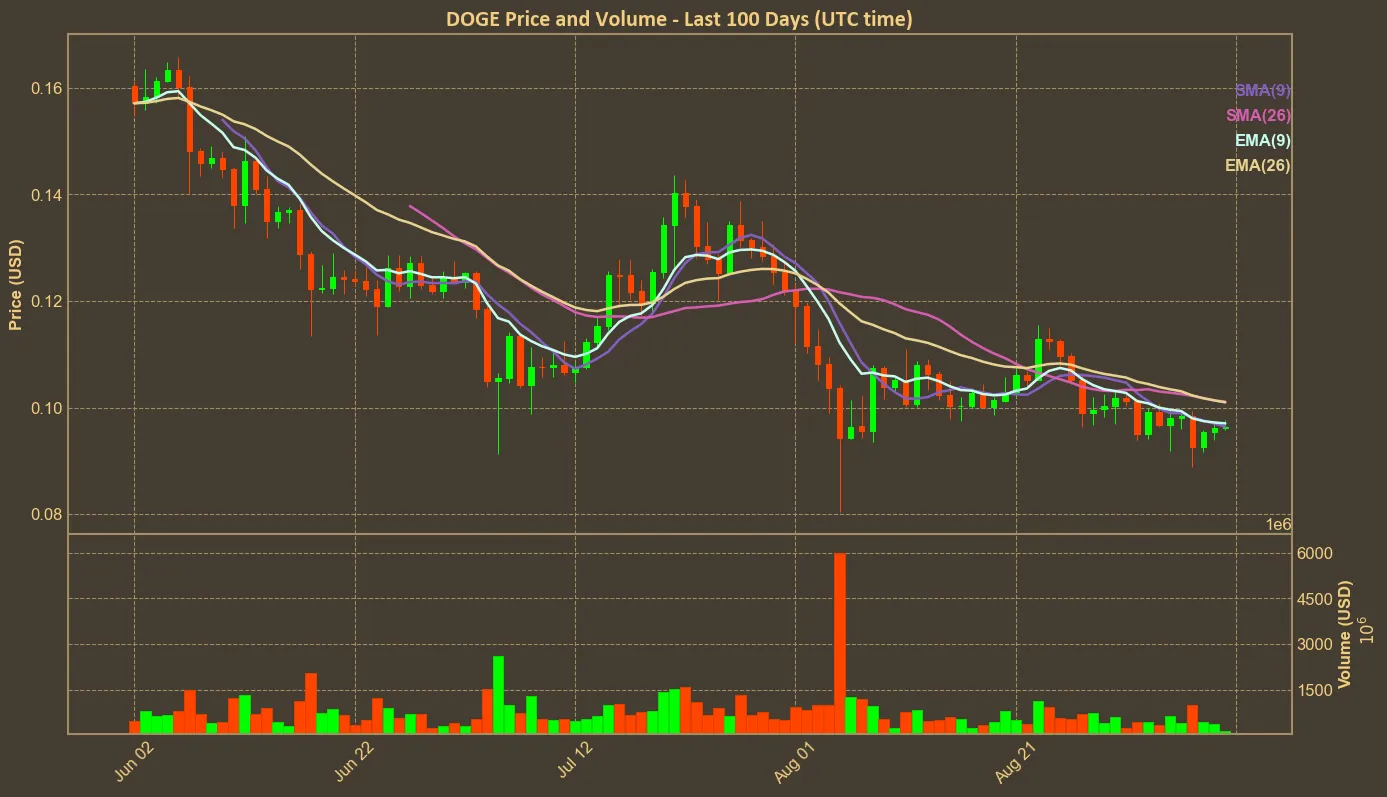
The Moving Averages, both Simple (SMA) and Exponential (EMA), currently position Dogecoin near the $0.101 mark, hinting at overhead resistance. The SMA and EMA changes reflect slight declines, with the SMA at 0.1011 and EMA at 0.101. These figures suggest that Dogecoin is in a consolidation phase, struggling to break past these averages.

The Moving Average Convergence Divergence (MACD) indicator, showing a slight negative divergence with a value of -0.0032, generally signals a bearish momentum. The Awesome Oscillator (AO) also points to a negative momentum, indicating that bearish forces may still prevail in the market.
The Bollinger Bands (BB), with the upper band at $0.1124 and the lower band at $0.0898, signal some volatility. Nevertheless, Dogecoin’s current price places it toward the lower range of these bands, indicating a potential for upward movement if it can manage to overcome the bearish sentiment.
Conclusion
From my perspective, Dogecoin’s current technical analysis presents a mixed picture. While the coin demonstrates potential for rebound, highlighted by long-term gains and current stabilization signs, bearish tendencies dominate the short-term outlook. The consistency in RSI and bearish indicators like MACD and AO suggest caution for investors eyeing short-term gains. However, those with a long-term view might see these price points as potential entry opportunities if they can tolerate the inherent short-term volatility of the market.
It is essential to remember that technical analysis has its limitations. It relies heavily on historical data and may not account for future market events or announcements that could drastically alter the coin’s trajectory. Investors should also consider other aspects like market sentiment, news, and broader financial trends before making any investment decisions.


