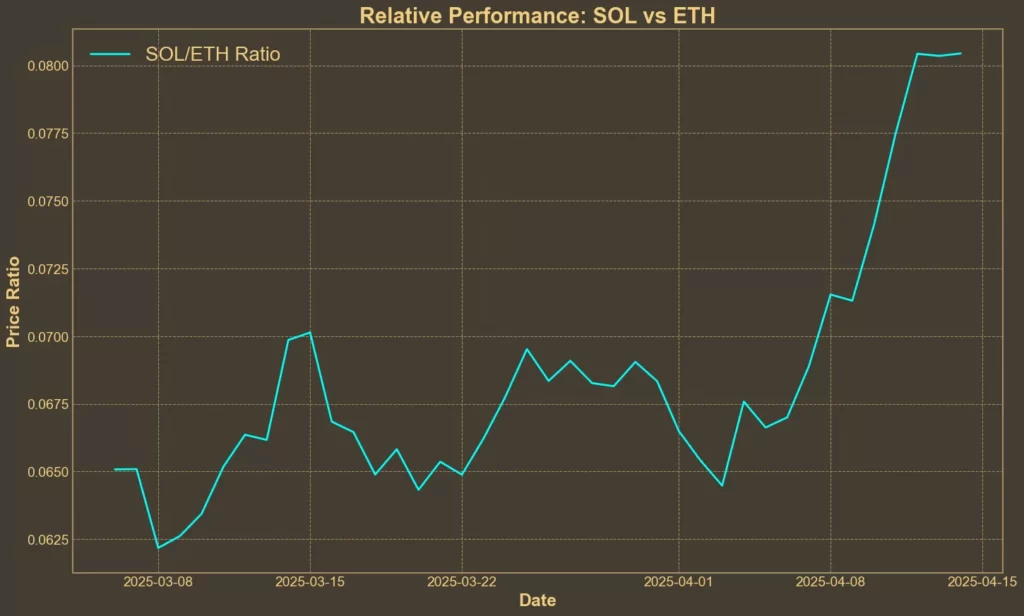
Solana has made a sharp recovery over the past week, jumping nearly 30% and reclaiming ground lost during the recent tariff-driven selloff. But the real story might be its performance against Ethereum. For the first time in history (except for a brief spike in January), the SOL/ETH ratio has crossed 0.08. At the time of writing, Solana is trading at $132 with renewed market interest and strong short-term momentum.
But underneath the price surge, technical indicators are sending a more mixed message.
Table of Contents
Momentum Indicators
RSI: Neutral
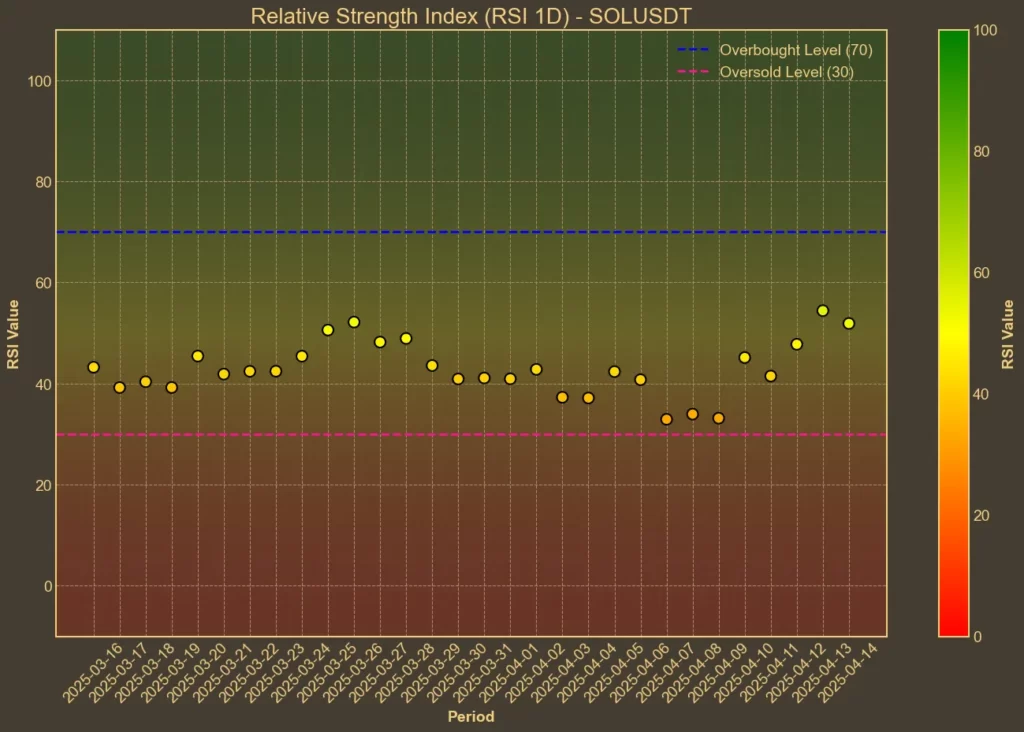
The Relative Strength Index is climbing fast. The longer-term RSI(14) moved from a low of 34 last week to 54 today. Short-term RSI(7) is at 63. That signals growing demand, but also hints the coin is starting to push into overheated territory. A few more green candles, and we’re likely to hit overbought zones.
MFI: Neutral
Money Flow Index, which includes volume in its calculation, is following a similar path. It has recovered from a low of 31 last week to 55 today. But unlike RSI, it hasn’t broken into bullish territory. That suggests the rally is still missing strong conviction from volume-heavy buyers.
Fear & Greed Index: Fear
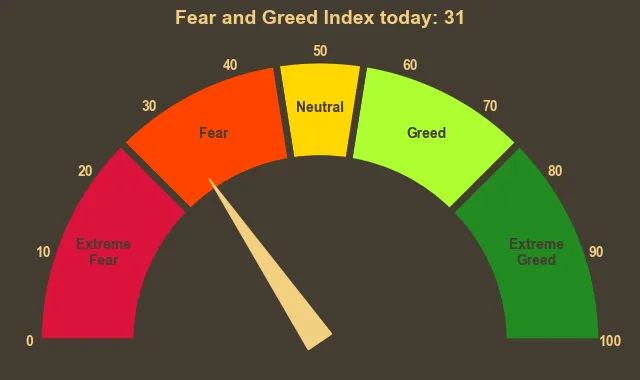
Across the broader crypto market, sentiment remains cautious. The Fear & Greed Index dropped from 45 to 31 over the past two days. This disconnect between Solana’s price and overall market emotion adds a layer of uncertainty. The rally might be real – but it’s not happening in a confident environment.
Moving Averages
SMA & EMA: Bullish Cross
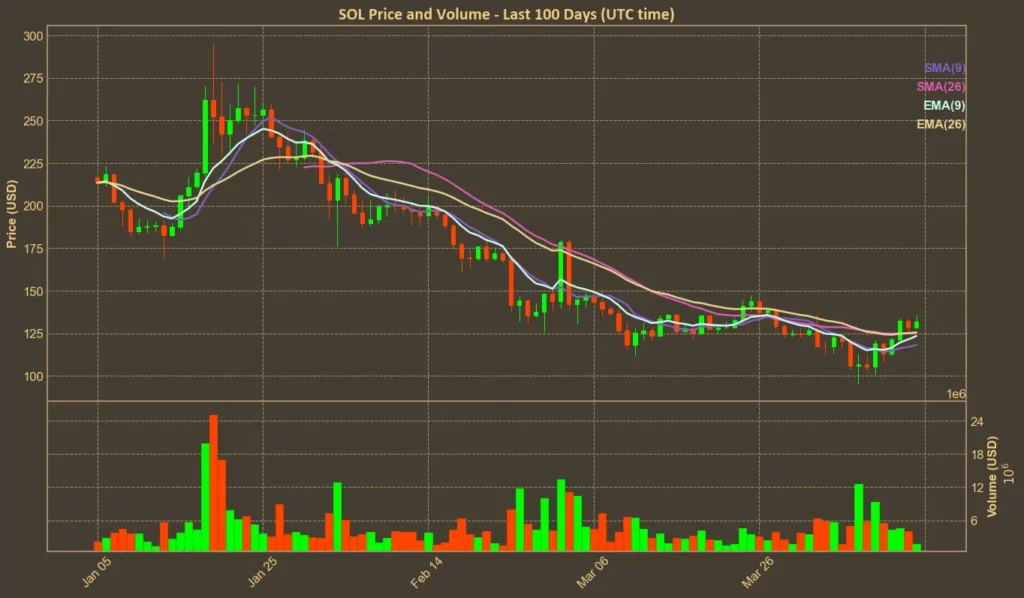
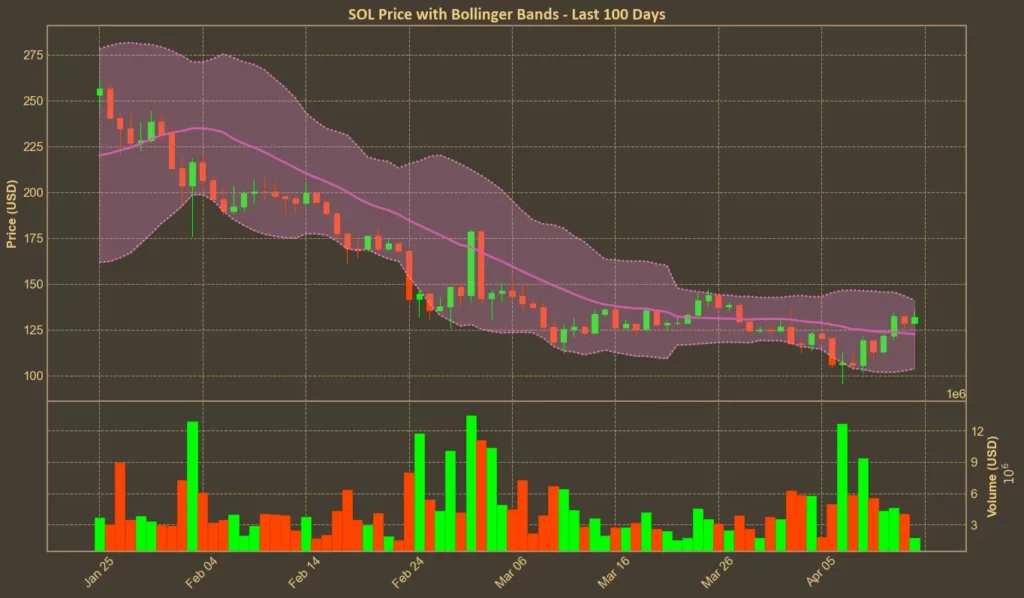
Both short-term and medium-term averages support the bounce. SOL is currently trading above the 9-day SMA (118) and EMA (123), as well as the 26-day SMA (125) and EMA (126). It’s a clear sign that momentum has shifted upward in the short run.
Bollinger Bands: Increased Volatility
With the price now sitting near the upper Bollinger Band (141), Solana is moving into potentially overbought territory. The lower band sits far below at 104. This widening gap shows higher volatility, and while it opens space for a breakout, it also makes a reversal more likely if buying pressure stalls.
Trend & Volatility Indicators
ADX: Weak Trend
Despite the big moves in price, ADX(14) remains low at 20. That means the current rally isn’t yet supported by a strong trend structure. Traders might be excited, but the market hasn’t fully committed.
ATR: Stable Volatility
Average True Range sits steady at 11.0, unchanged from last week. Even with the price rising sharply, underlying volatility hasn’t spiked. That’s either a good sign (orderly growth) or a warning that sudden moves are still possible.
AO: Bullish Shift
Awesome Oscillator shows an improving trend. From -15.0 last week to -2.0 today, the shift in momentum is clear – even though the values are still negative. A crossover into green territory would confirm the change.
VWAP: Overpriced
Volume-weighted average price is currently at 177 – well above the market price. That suggests SOL is still being bought below its average trading value, possibly indicating room for further upside. But it also shows how distorted the market has become after last week’s rally.
Relative Performance
Comparison Against ETH: Bullish
The SOL/ETH ratio has just crossed 0.08. It’s up 16.75% in the last week and 20.33% over the month. While Solana has recovered most of its losses from the recent tariffs-driven drop, Ethereum remains sluggish. The performance gap is widening, and right now, Solana is clearly leading.
Final Thoughts
Most indicators support the idea that Solana has momentum, but not all of them confirm this is a lasting move. RSI is approaching overbought levels. ADX is still low, signaling a weak trend. Volume indicators aren’t keeping up with price. And sentiment across the broader crypto market is stuck in fear.
At the same time, there are clear signs of strength. RSI has rebounded sharply from last week’s lows, reflecting renewed buyer interest. Both SMA and EMA have formed a bullish cross, often seen as a signal of trend continuation. The Awesome Oscillator, while still slightly negative, has recovered most of its downside and is closing in on a crossover. And the record-high SOL/ETH ratio suggests that, relative to its peers, Solana is gaining ground at a faster pace than many expected.
If this momentum holds, the next leg up could come with stronger confirmation. A rise in ADX or a surge in volume would shift more indicators into bullish territory.
Read also: Pump.fun’s Live Streaming Returns with Firm New Rules

