Solana (SOL) is currently priced at $153, experiencing significant declines over the past month and quarter, despite impressive gains over the last year. The market cap has dropped by over 40% in the past 30 days, reflecting a sharp downturn in investor sentiment. Meanwhile, trading volume has shown erratic spikes and drops, suggesting heightened investor activity but also uncertainty about the coin’s short-term direction.
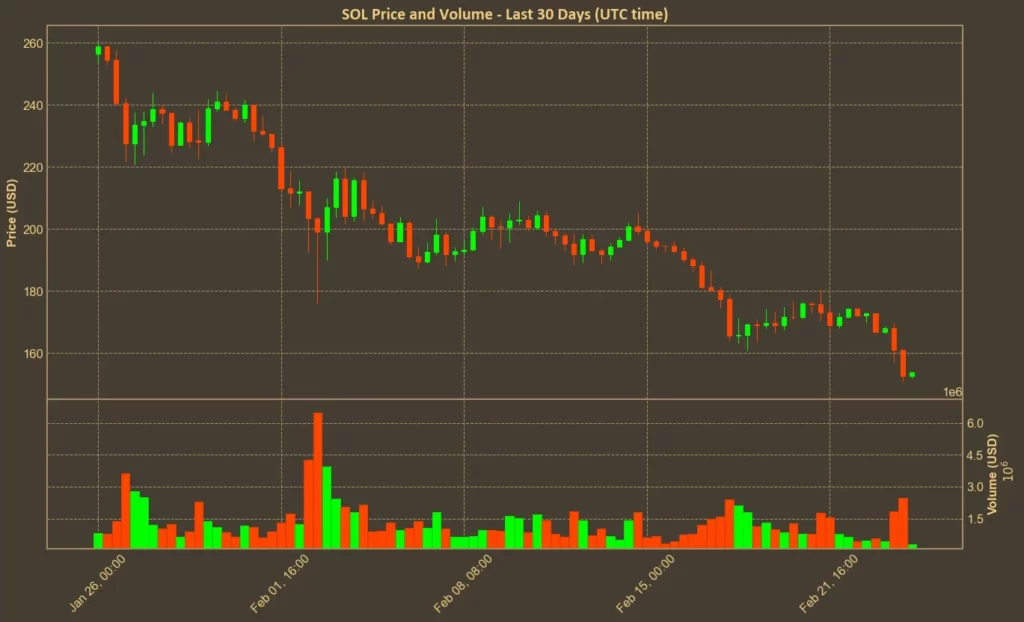
Technical analysis presents a mixed picture. Several indicators suggest that Solana is overbought, yet the overall trend indicates intense selling pressure. This comes despite investor optimism surrounding a potential ETF approval and the growing popularity of Pump.fun.
The looming release of over 11.2 million SOL tokens on March 1 is likely contributing to the selling pressure. Additionally, a slowdown in on-chain activity and a decline in active addresses suggest waning investor interest, raising concerns about the coin’s near-term performance.
Table of Contents
Momentum Indicators
RSI: Oversold
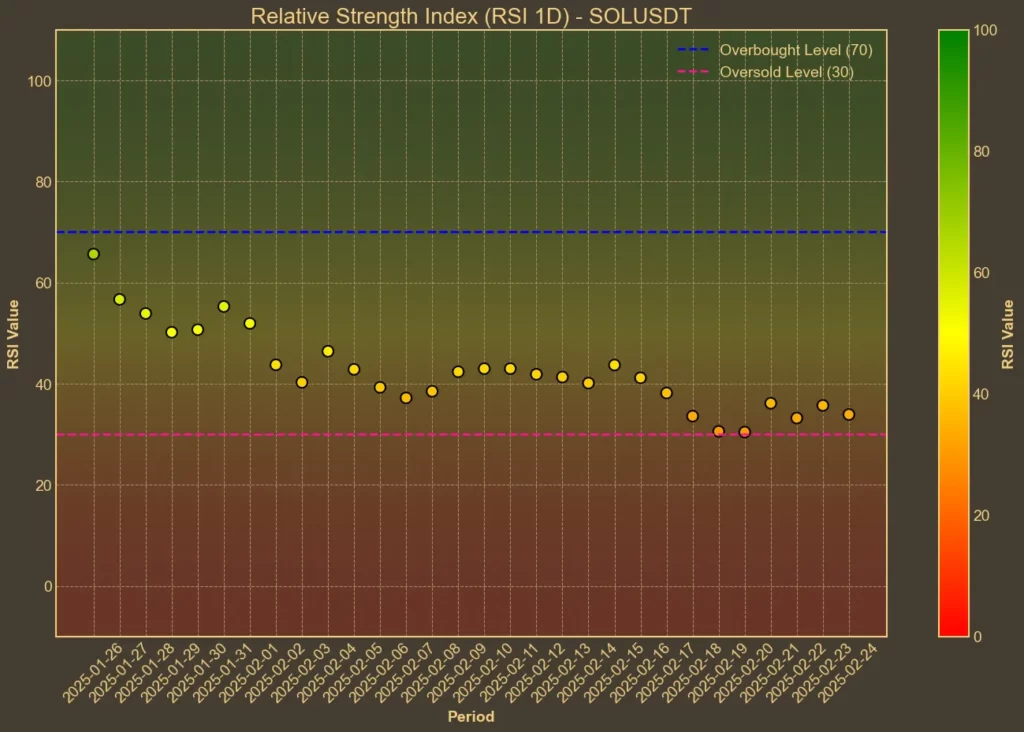
The Relative Strength Index (RSI) measures overbought or oversold conditions. Today, RSI(14) stands at 28, down from 34 a week ago, indicating oversold conditions. The short-term RSI(7) is even lower at 20, reflecting increased selling pressure. This suggests a possible rebound if buying interest returns, but caution is advised, as the trend remains bearish.
MFI: Oversold
The Money Flow Index (MFI) incorporates volume to gauge buying and selling pressure. Today’s MFI(14) is at 15, down from 49 a week ago, signaling oversold conditions. This sharp decline highlights a lack of buying interest, aligning with the overall bearish sentiment.
Fear & Greed Index: Neutral
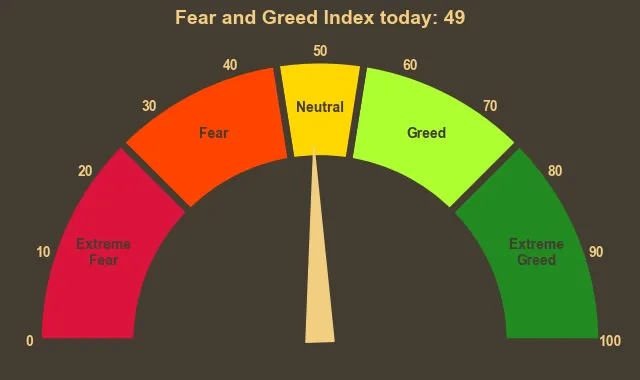
The Fear & Greed Index, reflecting the broader crypto market sentiment, is currently at 49, showing neutrality. This suggests that investors are cautious but not overly fearful.
Moving Averages
SMA & EMA: Bearish
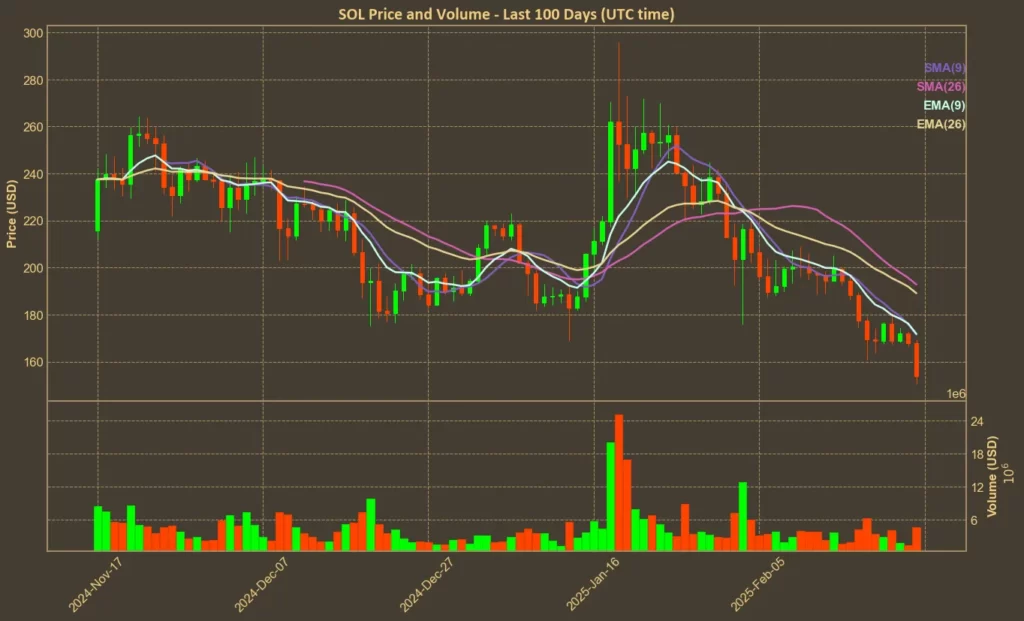
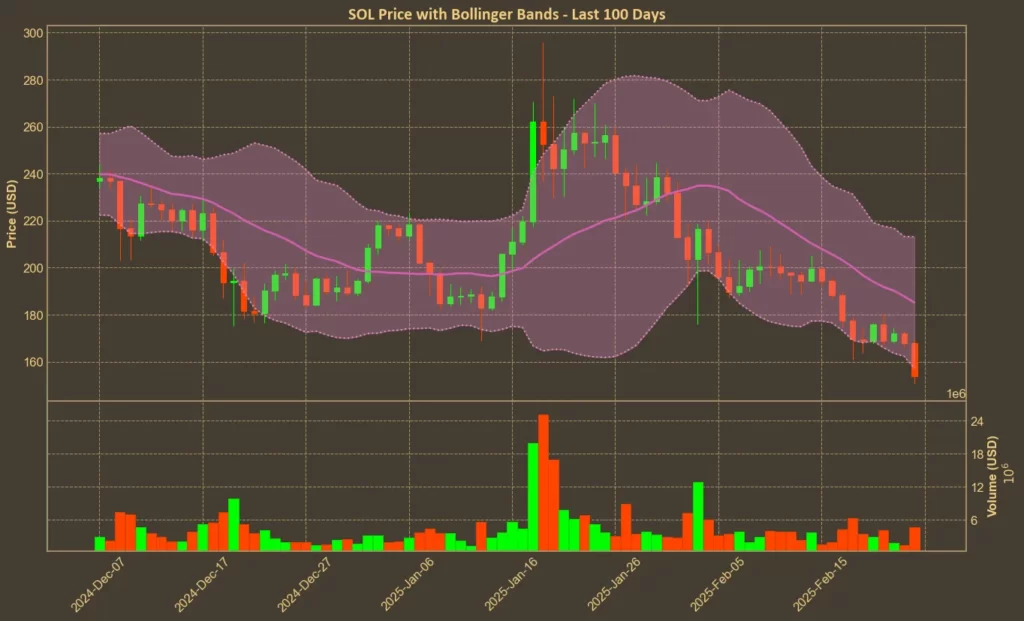
Solana’s Simple Moving Average (SMA) and Exponential Moving Average (EMA) both indicate a bearish trend. The SMA(9) is at 171.0, and EMA(9) is at 172.0, both above the current price of $153. Similarly, the longer-term SMA(26) at 193.0 and EMA(26) at 189.0 reinforce the bearish outlook. This pattern suggests continued downward pressure unless the price breaks above these moving averages.
Bollinger Bands: Increased Volatility
Bollinger Bands measure volatility and potential breakout points. Currently, the price is near the lower band of 157.0, indicating oversold conditions. If the price rebounds from this level, it could signal a short-term recovery, but a breach below may lead to further declines.
Trend & Volatility Indicators
ADX: Strong Trend
The Average Directional Index (ADX) measures trend strength. Today’s ADX(14) is at 31, indicating a strong downward trend. This suggests that the current bearish momentum could persist.
ATR: Decreasing Volatility
The Average True Range (ATR) is at 14.0, unchanged from yesterday but down from 16.0 a week ago. This indicates reduced price swings, suggesting that the market may be stabilizing after recent volatility.
AO: Bearish Momentum
The Awesome Oscillator (AO), which confirms trend momentum, is at -37.0, consistent with recent negative values. This points to continued bearish momentum, although the decline is slowing.
VWAP: Bearish
The Volume Weighted Average Price (VWAP) is at 221.0, significantly above the current price. This indicates that Solana is trading below its volume-weighted average, reflecting bearish sentiment.
Relative Performance
Comparison Against BTC: Underperforming
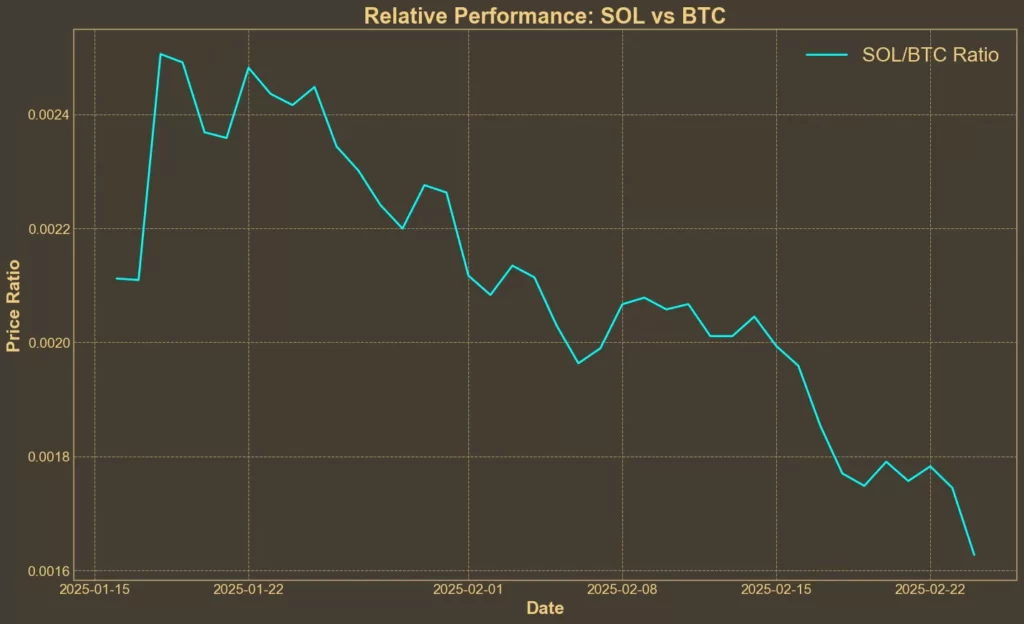
Solana’s performance relative to Bitcoin has weakened, with the SOL/BTC ratio decreasing by over 12% in the past week and 30% in the last month. This trend indicates a continued loss of relative strength, highlighting Bitcoin’s dominance in the current market.
Conclusion
Technical indicators collectively suggest that Solana is in a bearish phase, with strong downward momentum and oversold conditions. The RSI and MFI highlight overselling, while moving averages and VWAP confirm a bearish trend. However, the oversold signals also indicate the possibility of a short-term rebound if buying interest resumes.
It’s important to remember that technical analysis has its limitations. It only reflects past price actions and may not fully account for future market dynamics. External factors such as regulatory news, macroeconomic trends, and investor sentiment could significantly influence Solana’s price movements.
Some media outlets are promoting Solaxy, a new coin claiming it to be the first Solana layer-2 solution. But before you get caught up in the hype, you should know that our investigation uncovered serious red flags. If you’re considering investing in this presale, make sure to read our report first.


