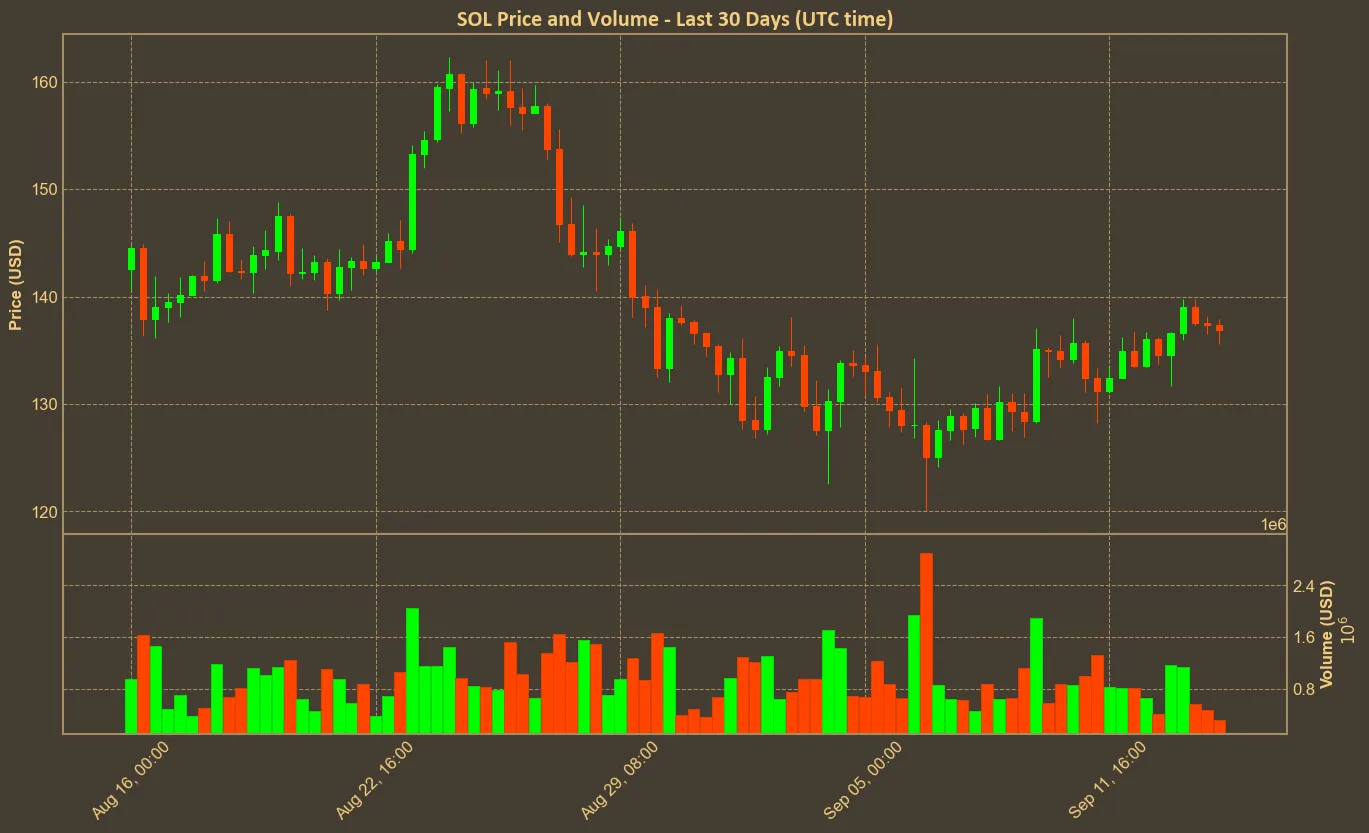
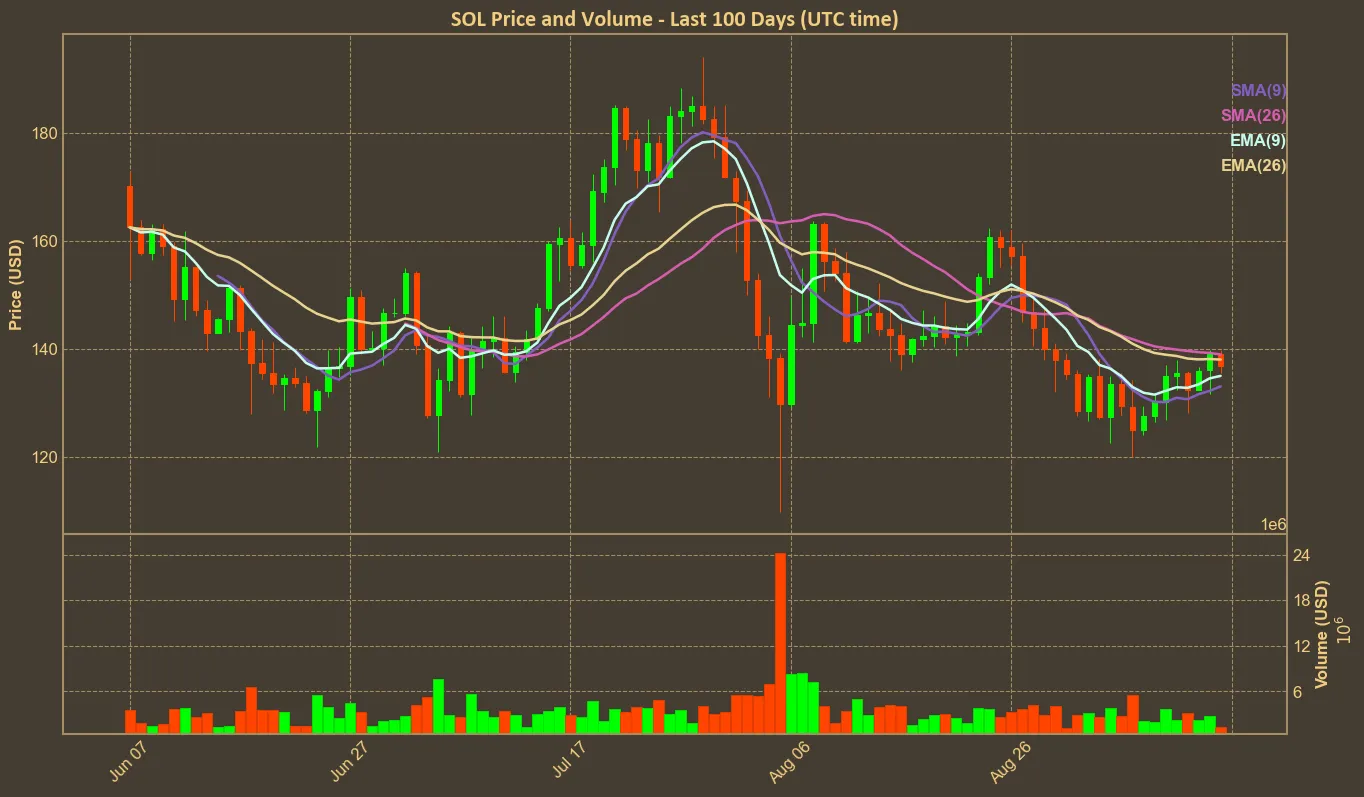
Solana has always been a coin of interest due to its speed and efficiency, but recent technical analysis reveals intriguing trends. Currently holding the 5th position in the cryptocurrency market, Solana’s price is $137. Over the past week, it has shown a notable upward movement, gaining over 7%. However, this optimism contrasts with its more extended timeline performance, with the last quarter experiencing an 8% decline.

Short-term Indicators and Market Sentiment
The recent data shows a mixed bag for Solana. While the coin experienced a marginal negative hourly change and a daily decline of -1.5%, the weekly gain signals fluctuating market sentiments. Market cap movements are also telling a similar story. Solana’s market cap in the last seven days increased by 1.9%, yet it still faced a monthly drop of 3.8%. These changes suggest intermittent investor confidence, which may not be strong enough to indicate a persistent trend.
Volume and Market Dynamics
Volume changes are crucial for understanding market liquidity and pressure. Solana experienced a significant drop in volume (-31.5%) over the last day and a considerable decrease (-65.1%) in the past month. Such drastic changes could signal a shift in investor interest or trading dynamics. Low volume can often precede price volatility, leading to unpredictable price movements in the short term.
Technical Indicators: Mixed Signals
A look into technical indicators reveals the complexity of Solana’s current state. The Relative Strength Index (RSI) is hovering around 49, suggesting a market neither overbought nor oversold. However, the price is slightly below both the Simple Moving Average (SMA) of 139.0 and the Exponential Moving Average (EMA) of 138.0, hinting at potential bearish momentum.

The Moving Average Convergence Divergence (MACD) indicator stands at -3.0 with a signal line at -4.0, indicating a bearish crossover. This aligns with the Awesome Oscillator (AO), which is negative at -5.0. These signals can be interpreted as short-term bearish sentiment prevailing in the market. Coupled with an Average True Range (ATR) of 8.0, reflecting moderate volatility, traders need to be cautious.
Conclusion
While Solana shows some promising short-term gains, the overall technical indicators suggest caution. The RSI’s mid-range position and falling volume are concerning. They indicate a lack of strong buying momentum, which could lead to further price declines or stagnation.
It’s essential to recognize that technical analysis relies on historical data and might not accurately predict future performance. External factors, news, and broader market conditions should also be considered for a comprehensive view.


