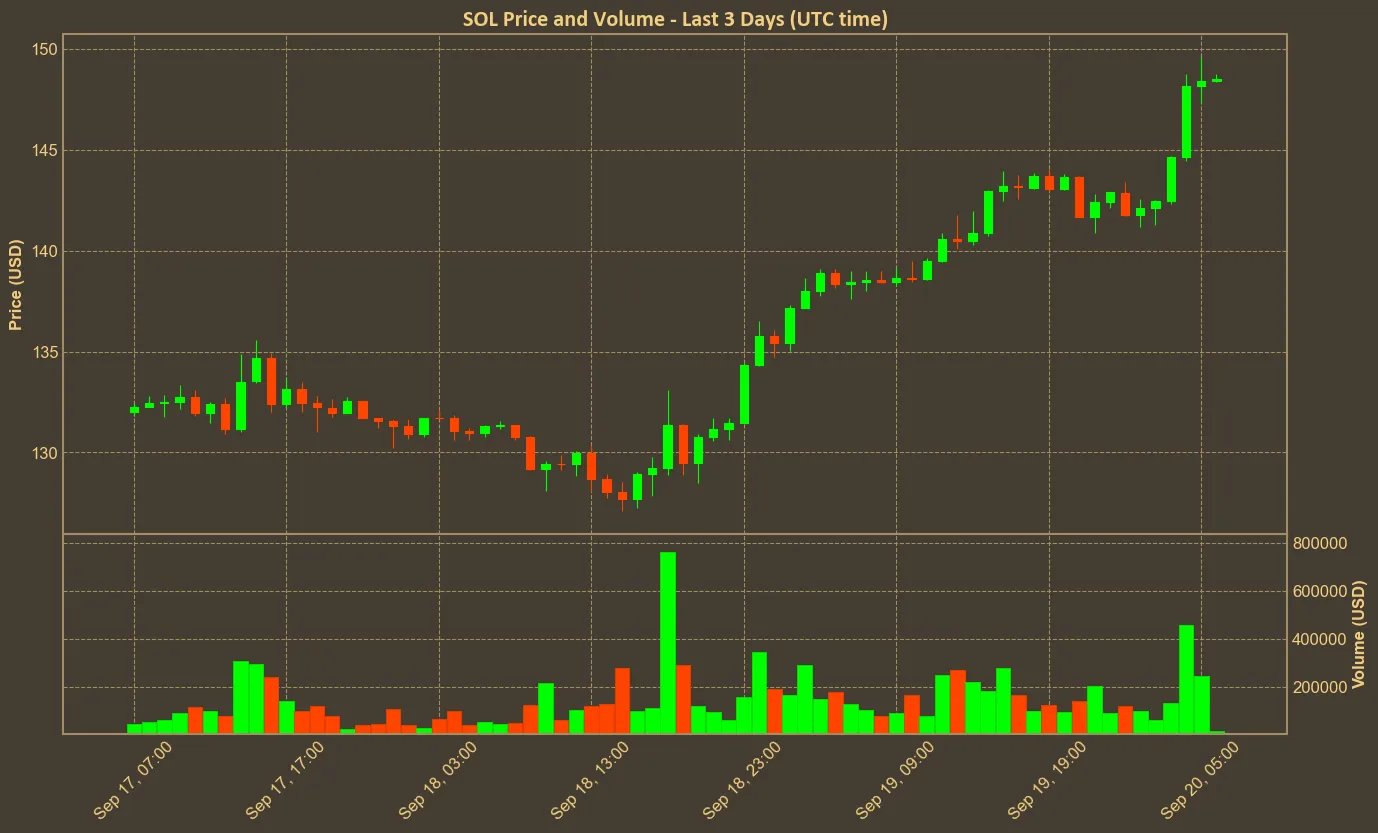
Solana has recently shown noteworthy developments in both its market performance and technological advancements. Ranked #5 in the cryptocurrency market, Solana’s price at the moment is $148, reflecting significant growth over the past year at nearly 640%. This showcases the growing interest and investment in this blockchain platform.
Table of Contents
Price and Market Cap Trends
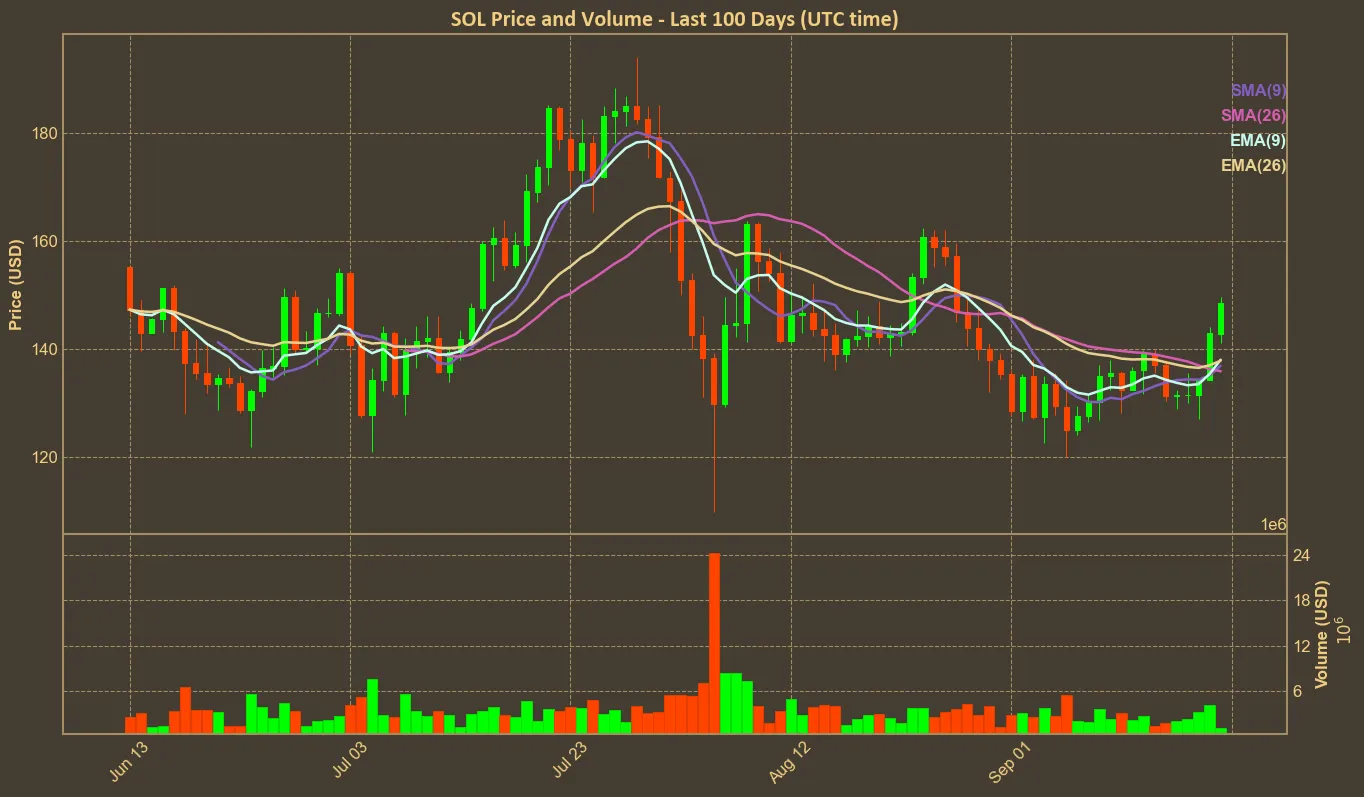
The notable price increases in the last day (7.2%) and last week (10.3%) suggest positive short-term momentum. This trend extends over the past quarter with an impressive rise of 9%. However, the month-to-month increase is a moderate 3.5%, indicating some short phases of stability within the longer-term upward trajectory. Another essential aspect is the market cap, which increased by 4.1% on the last day and 14.3% over the last week. These changes reflect growing confidence among investors, potentially influenced by favorable news and technological developments within the Solana ecosystem.

However, despite the bullish trends, the current volume change shows some volatility. The last day saw a slight decrease of 1.25% and a more noticeable reduction in the past three days (-10.9%). This is contrasted by substantial volume increases in the last week (62.3%) and month (63.9%). This inconsistency signals that while interest remains high overall, it fluctuates significantly in the short term, possibly responding to market news or investor sentiment.
Technical Indicators and Implications
The Relative Strength Index (RSI) has climbed from 44 a week ago to 60 today, suggesting that Solana is moving away from oversold conditions and into a more neutral or potentially overbought territory. The RSI trend supports the idea of rising investor confidence. Meanwhile, the Simple Moving Average (SMA) and Exponential Moving Average (EMA) are relatively steady, both moving closely around the $136-$138 range. The Moving Average Convergence Divergence (MACD) indicator suggests a bearish trend with a value of -1.0, although it is an improvement from previous values.

The Bollinger Bands (BB_H and BB_L) range between $123 and $144, indicating a moderate level of volatility. The Average True Range (ATR) of 8.0 also supports this reflection of volatility within a relatively stable uptrend. Another point to consider is that the Awesome Oscillator (AO) has shown negative values, although it is improving from a week ago, moving from -6.0 to -3.0 today. This hints at some underlying negative momentum that could pose a risk if it persists.
Conclusion
Solana’s recent market performance has been predominantly positive, supported by fundamental technical indicators. Yet, it is crucial to keep in mind the inherent limitations of technical analysis. These metrics can provide insights into market behavior, but they do not account for sudden changes in investor sentiment or unforeseen technological issues, which Solana has experienced in the past. While the outlook appears optimistic, investor caution is advised, and continuous monitoring of market signals is essential to navigate this evolving landscape.


